Iterations Project: Big Butte Small
The Big Butte Small elevation file was for an isolated mountain located in southeastern Idaho.
The terrain isn't as complex as some of the other test cases but is ideal for looking at the lee side of a hill.
Graphs Explained
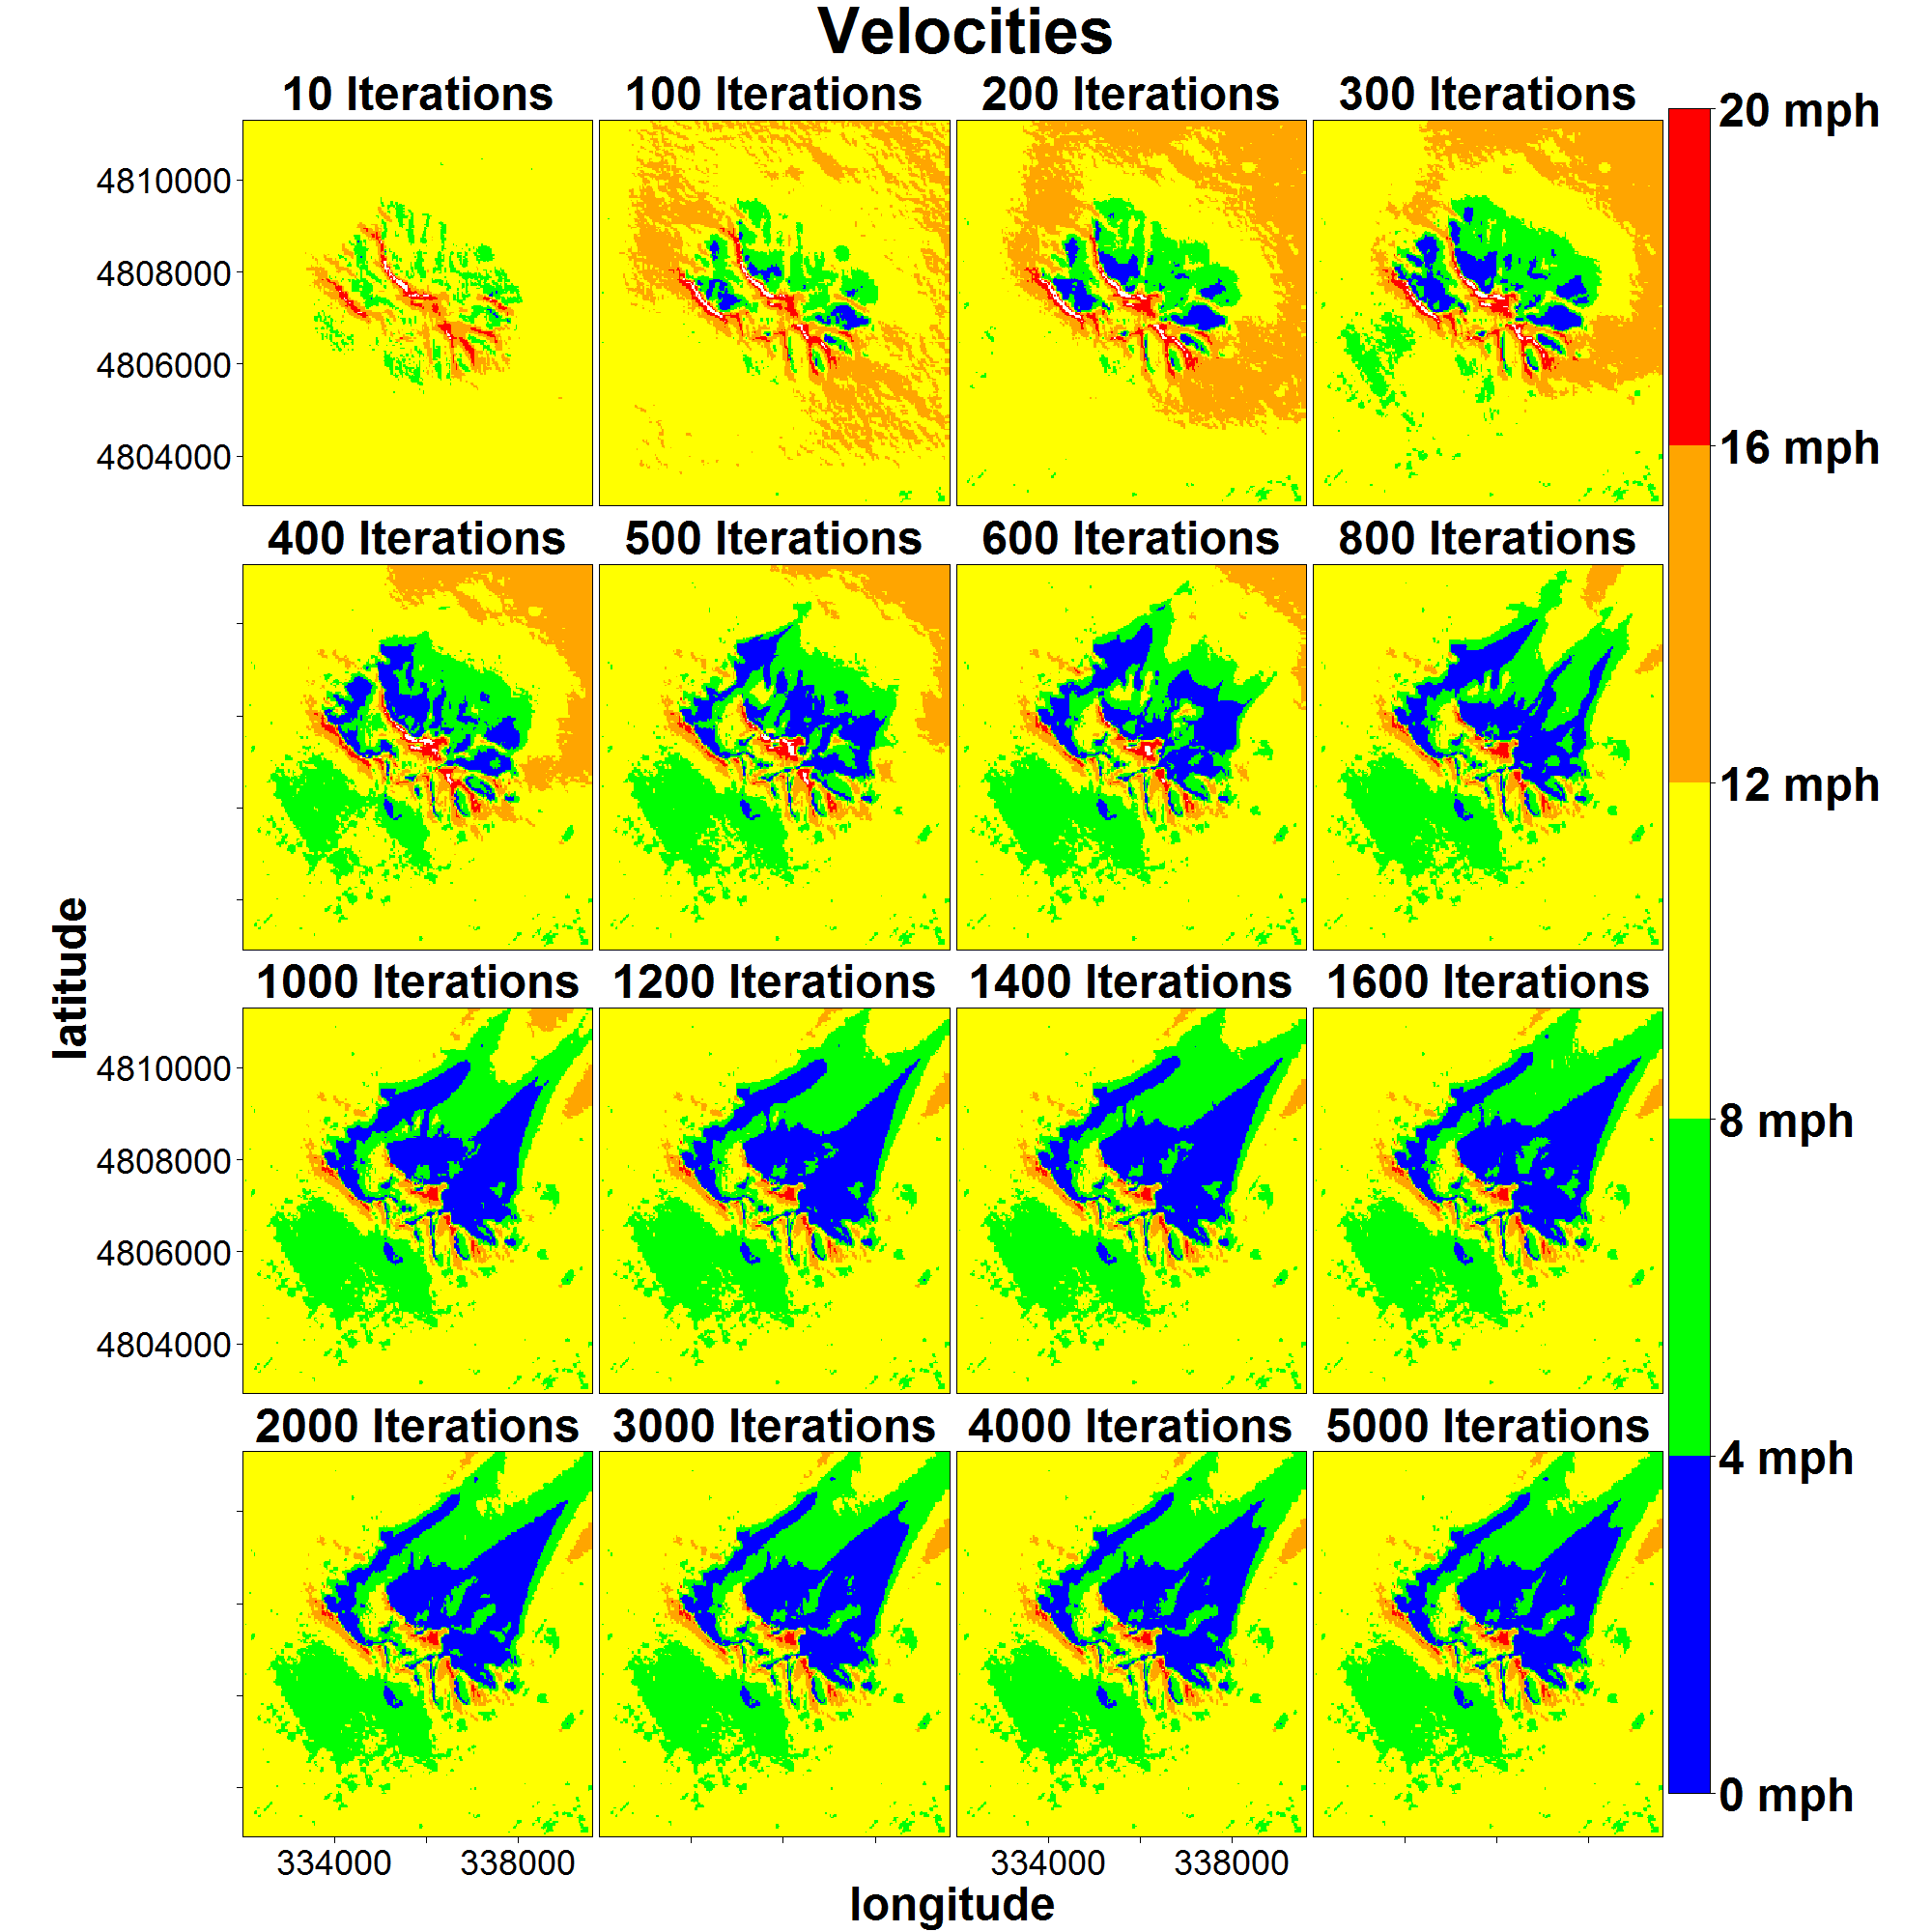
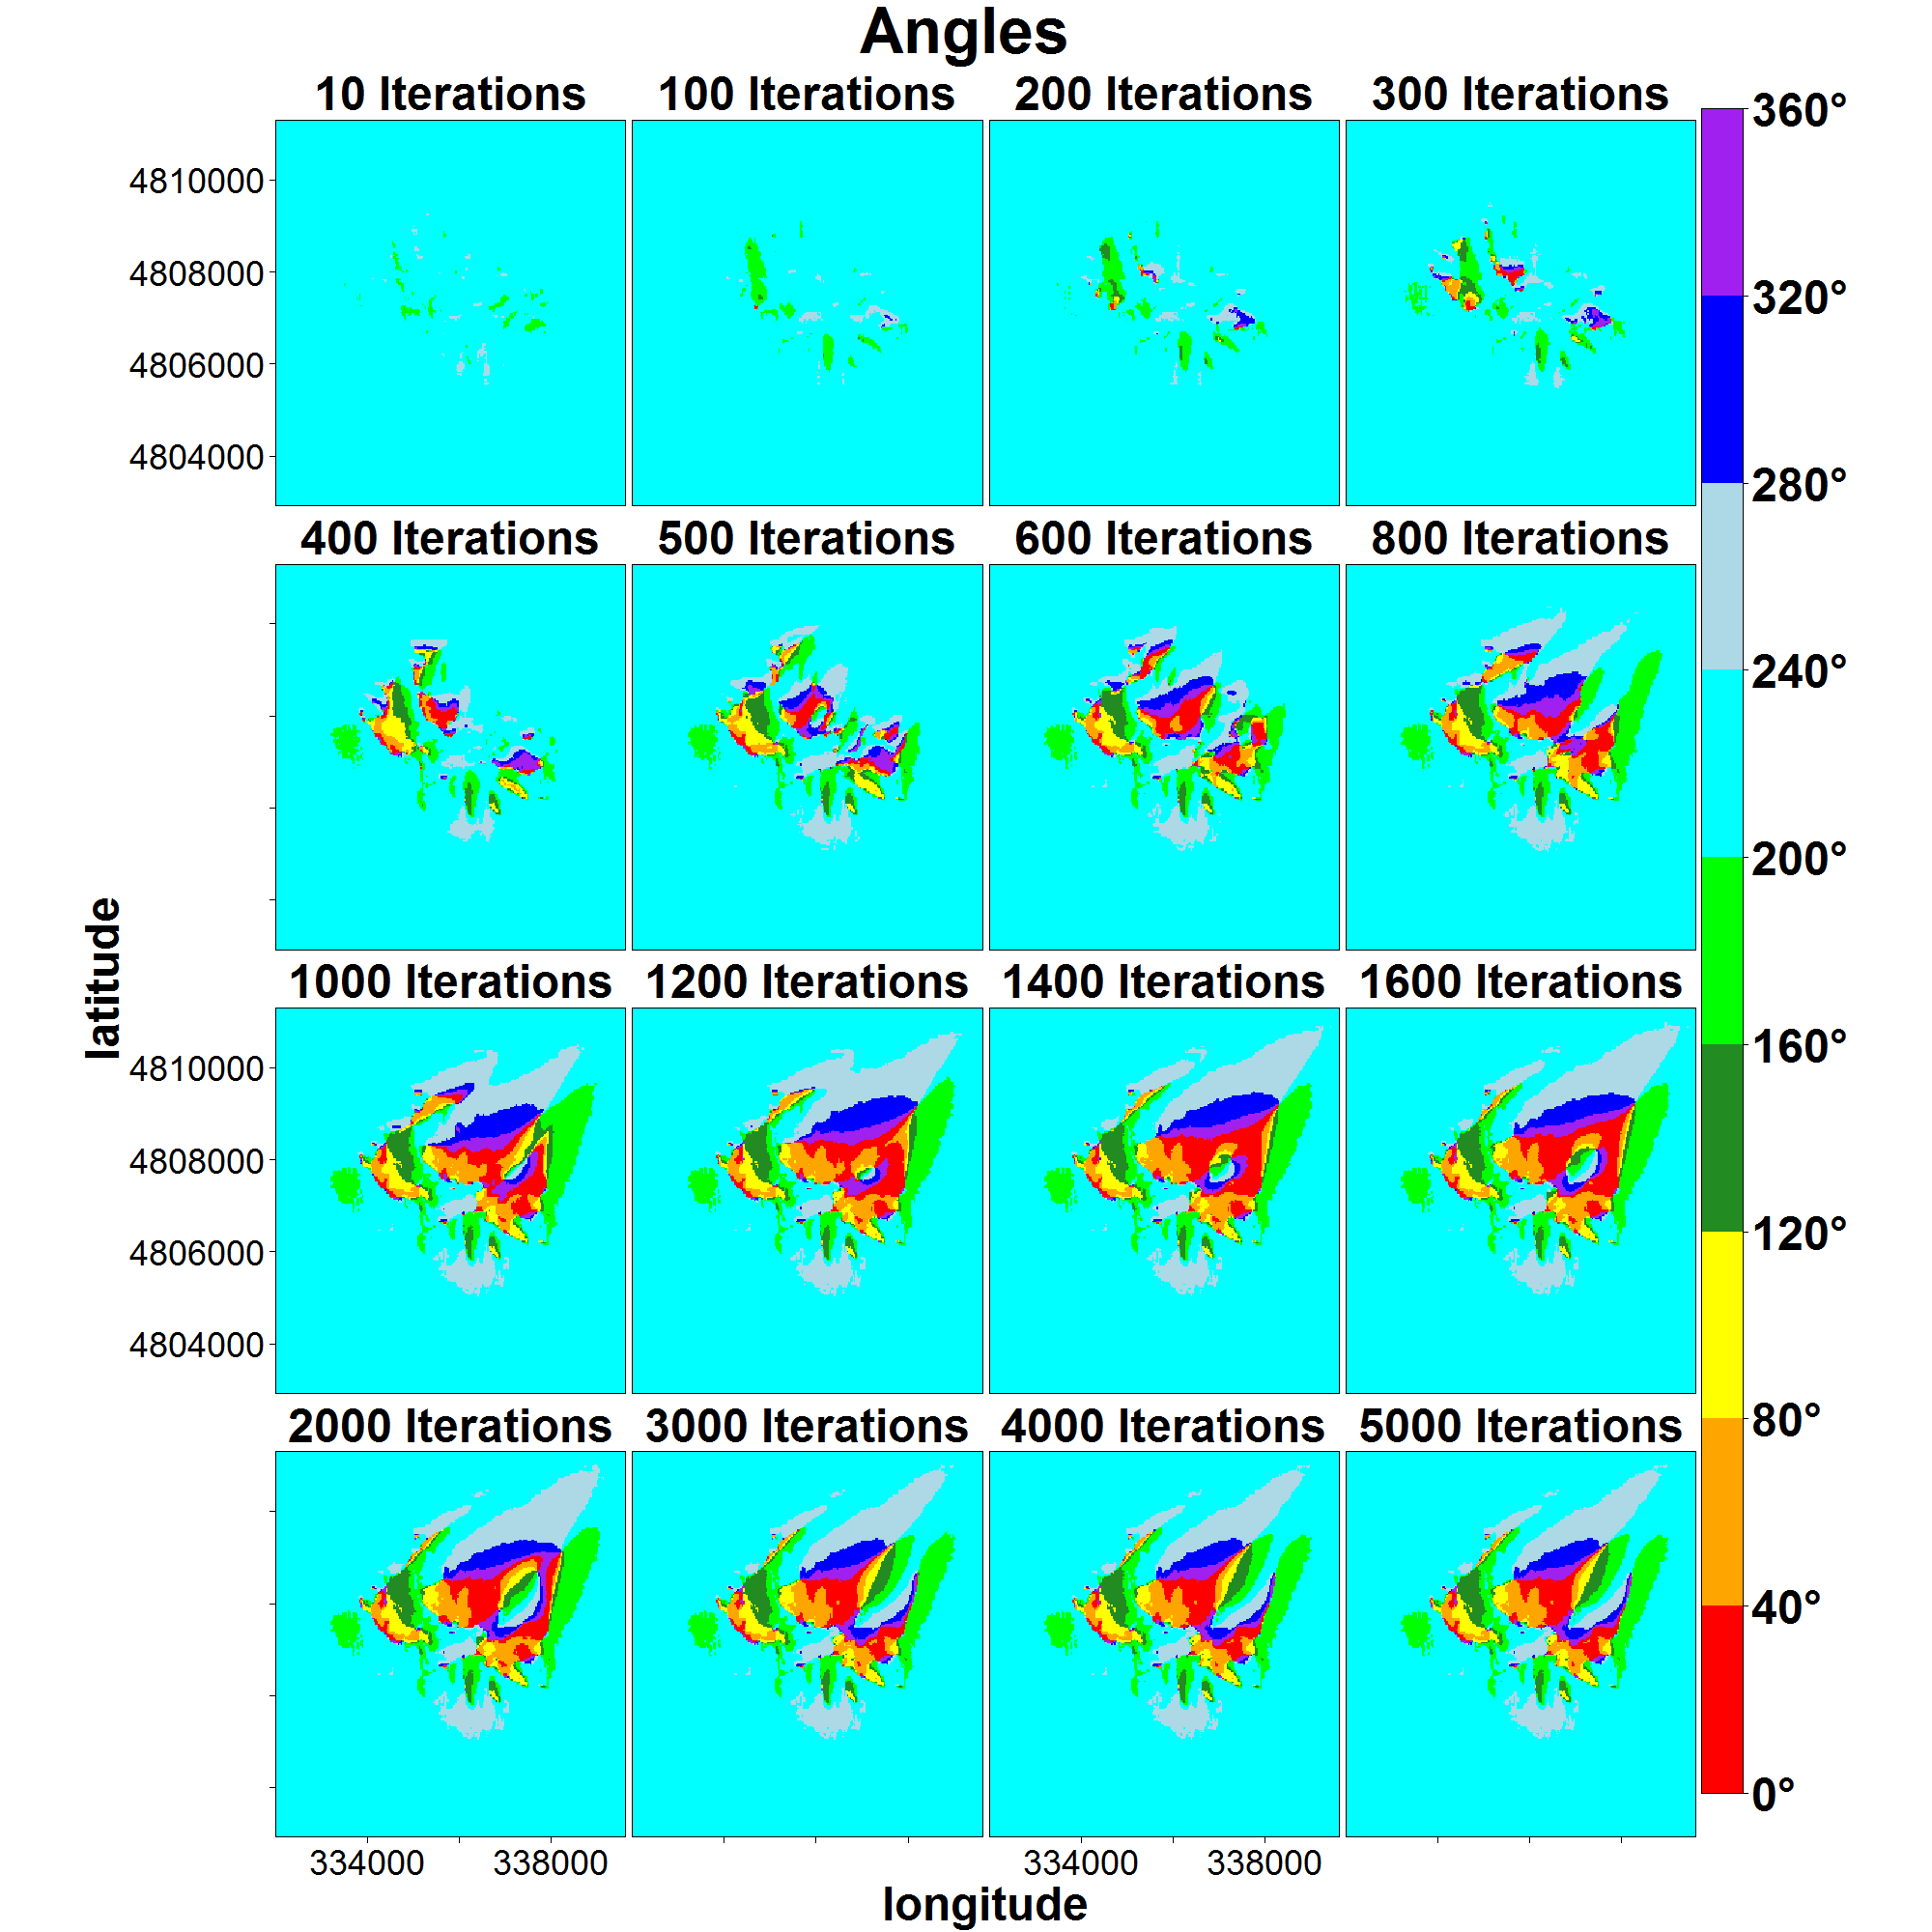
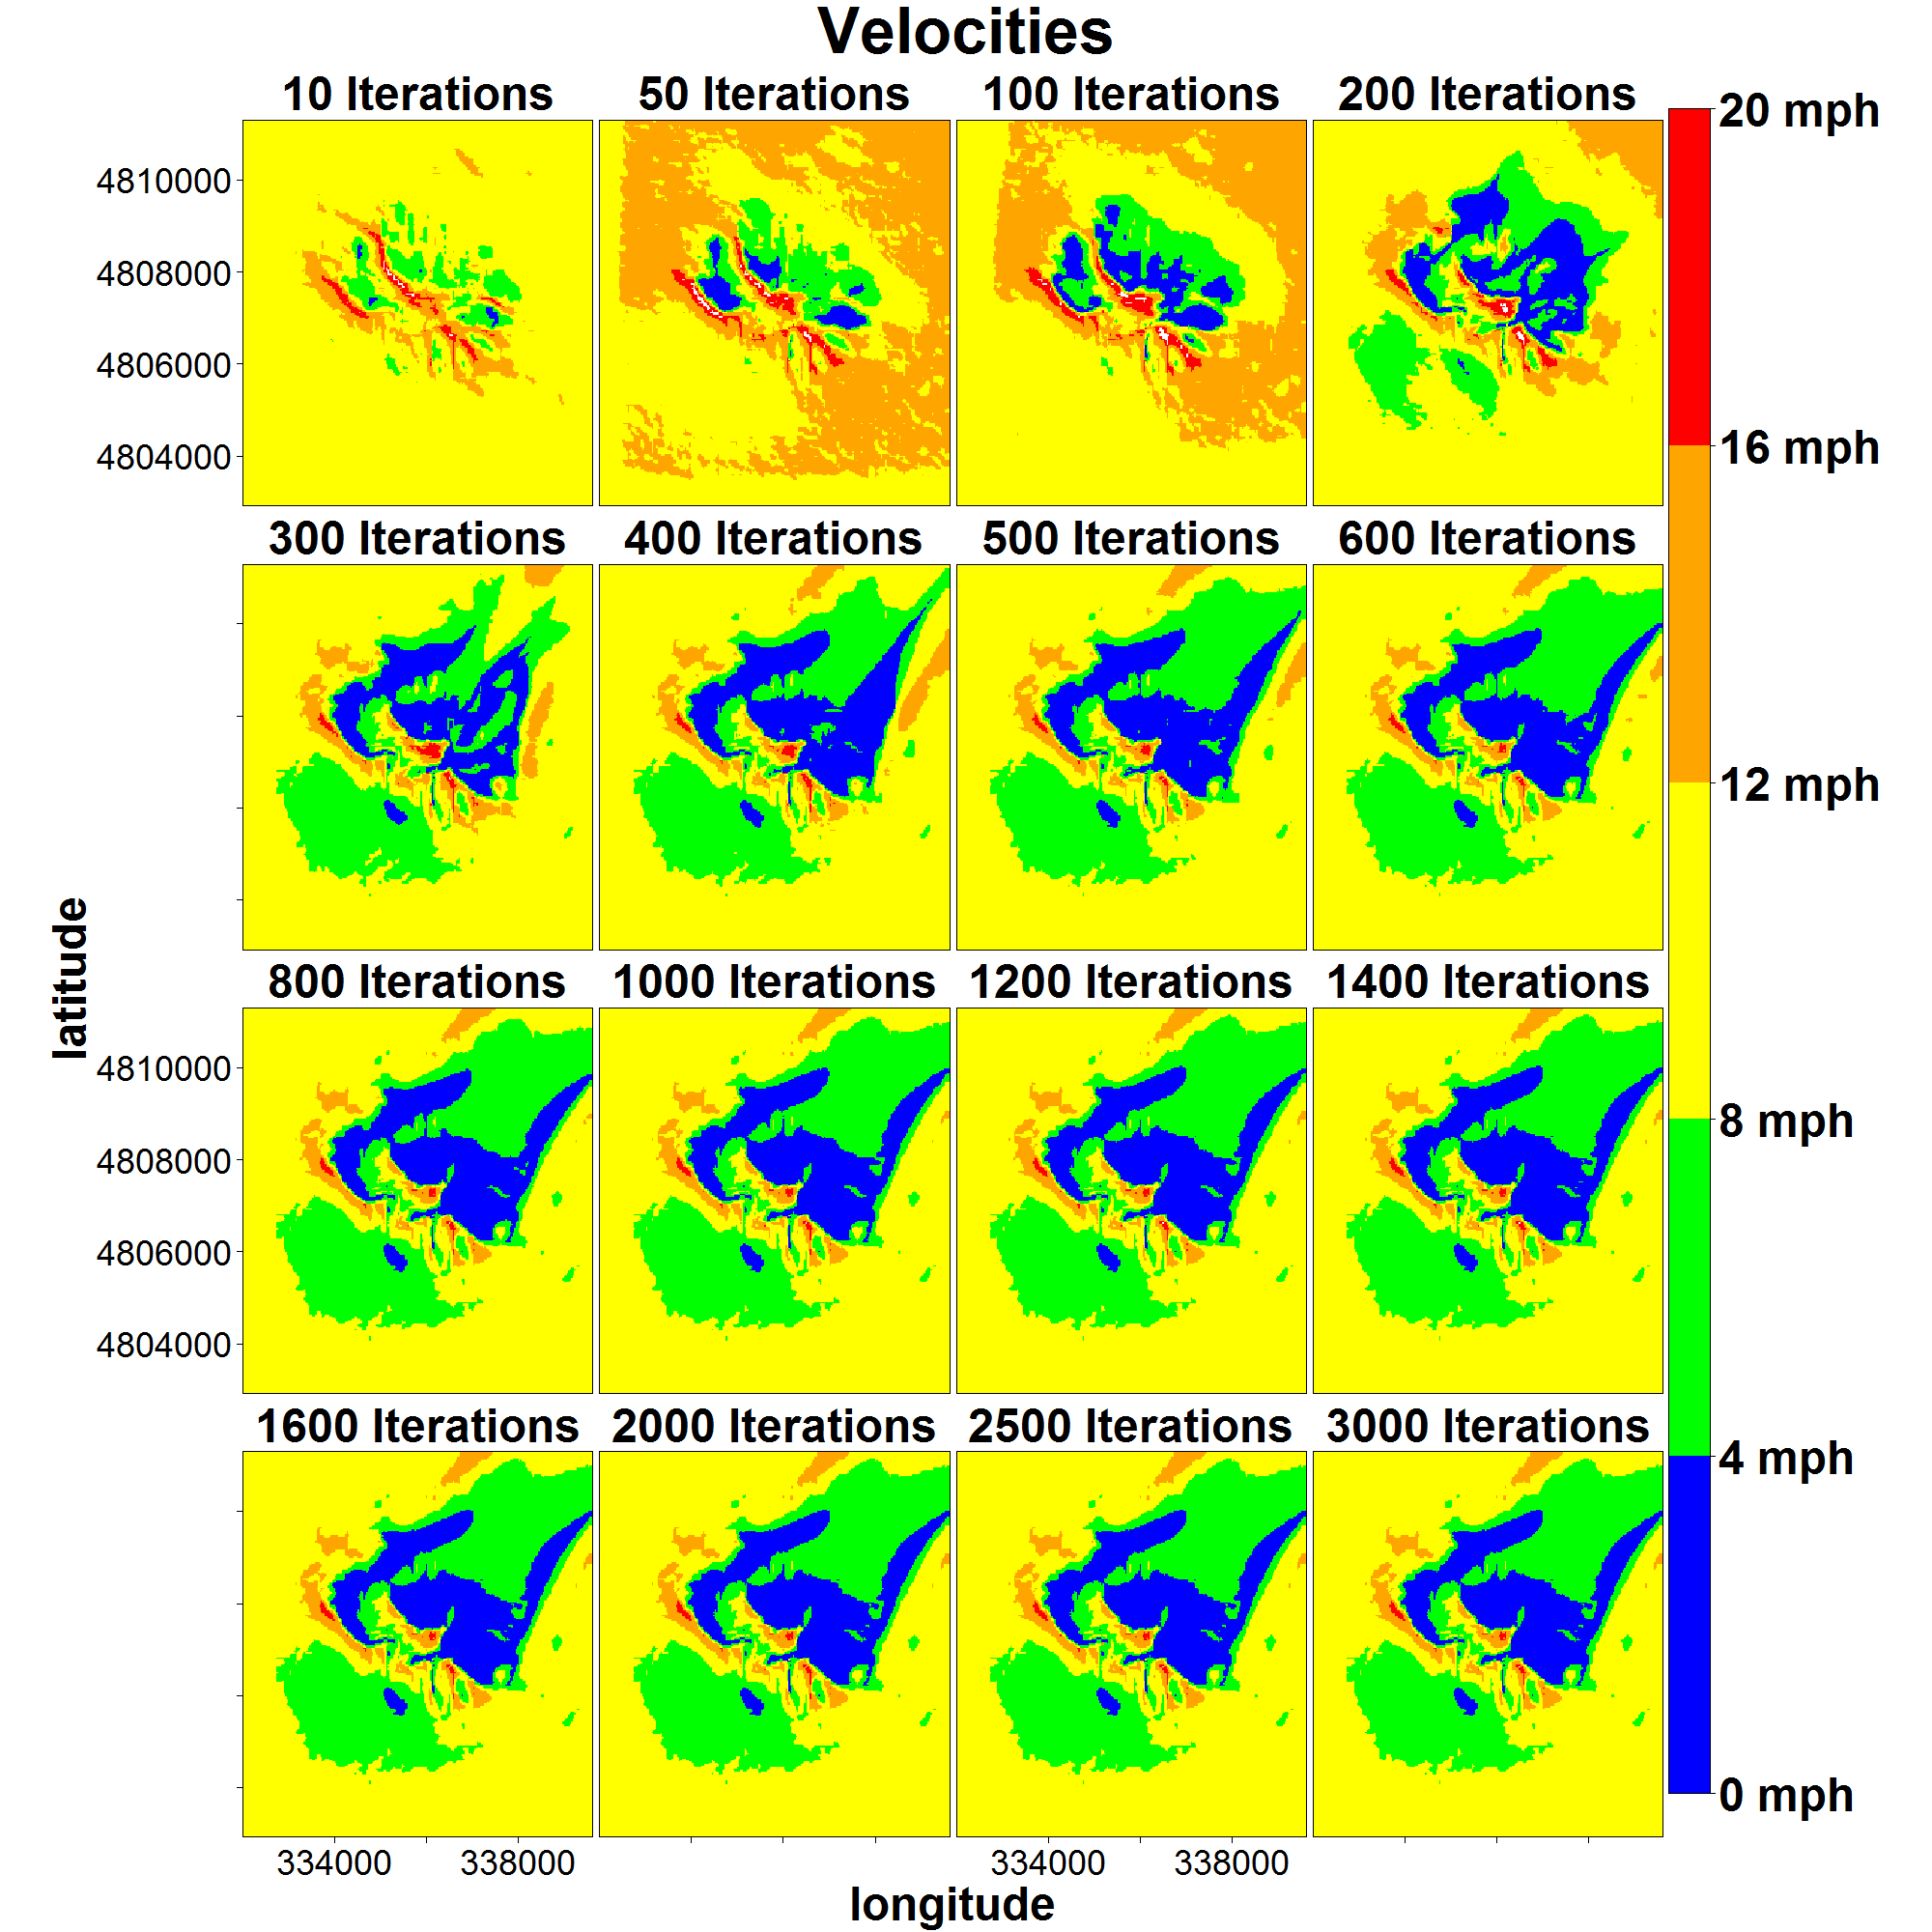
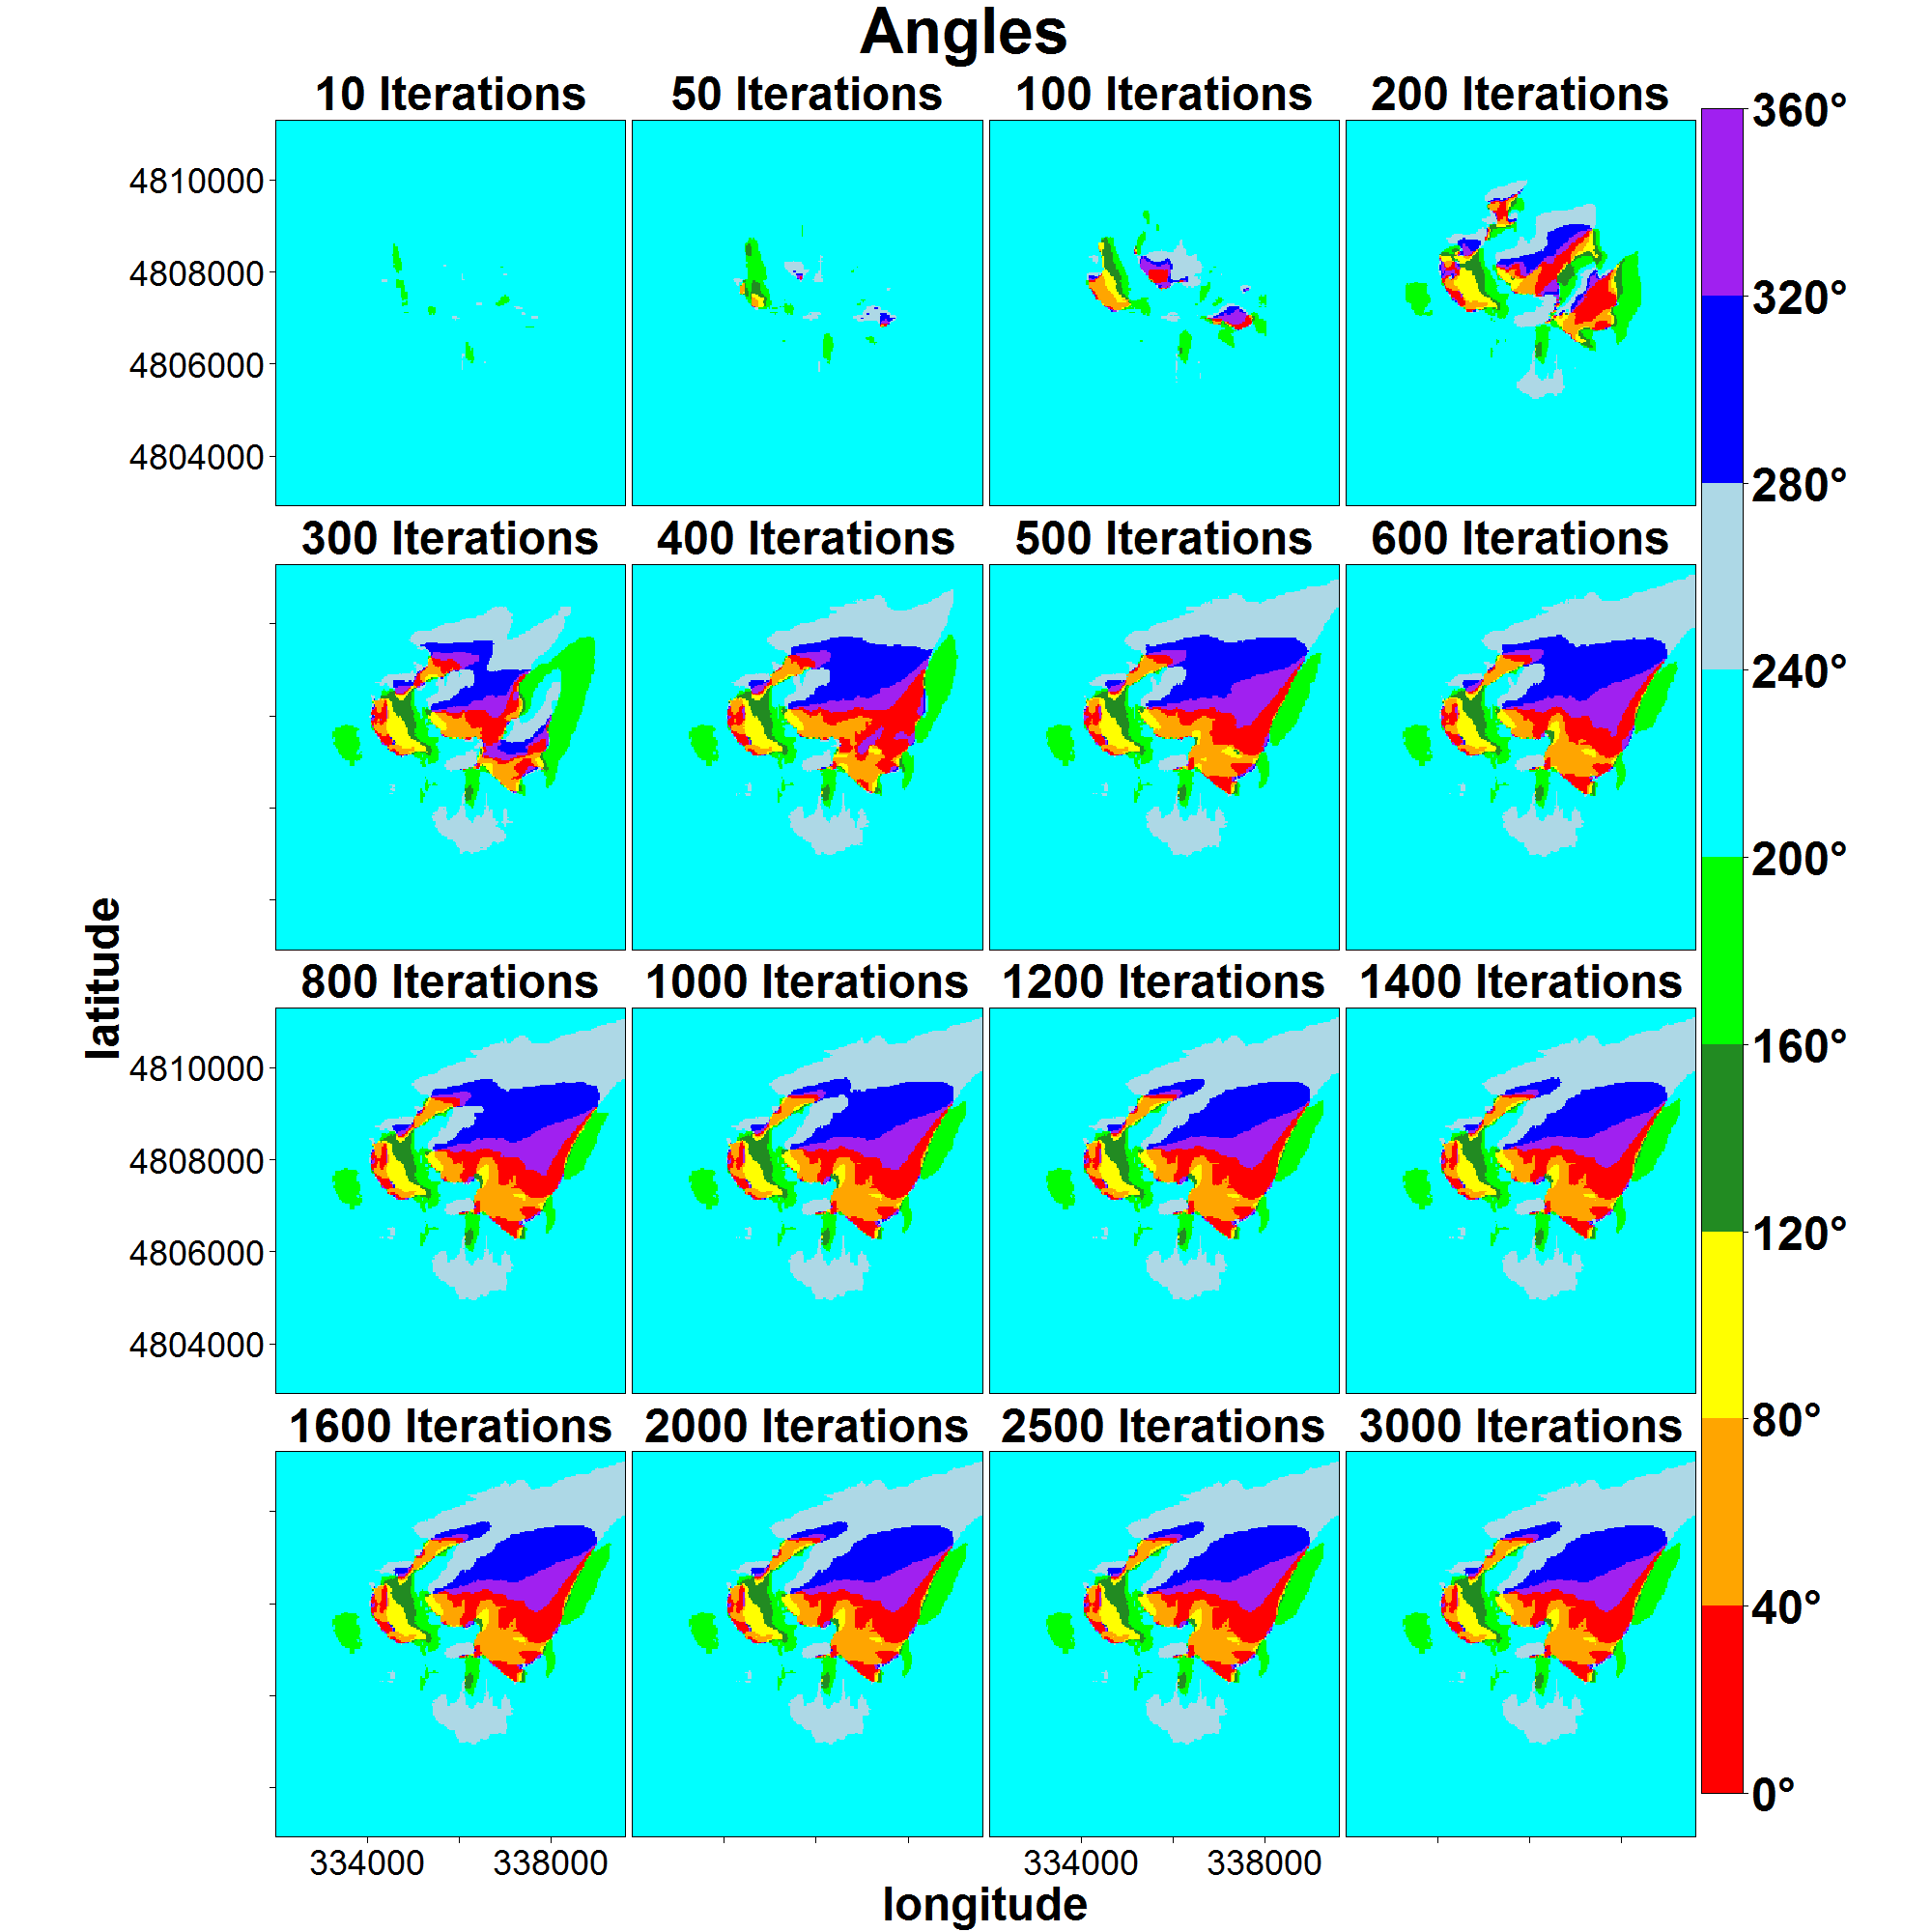
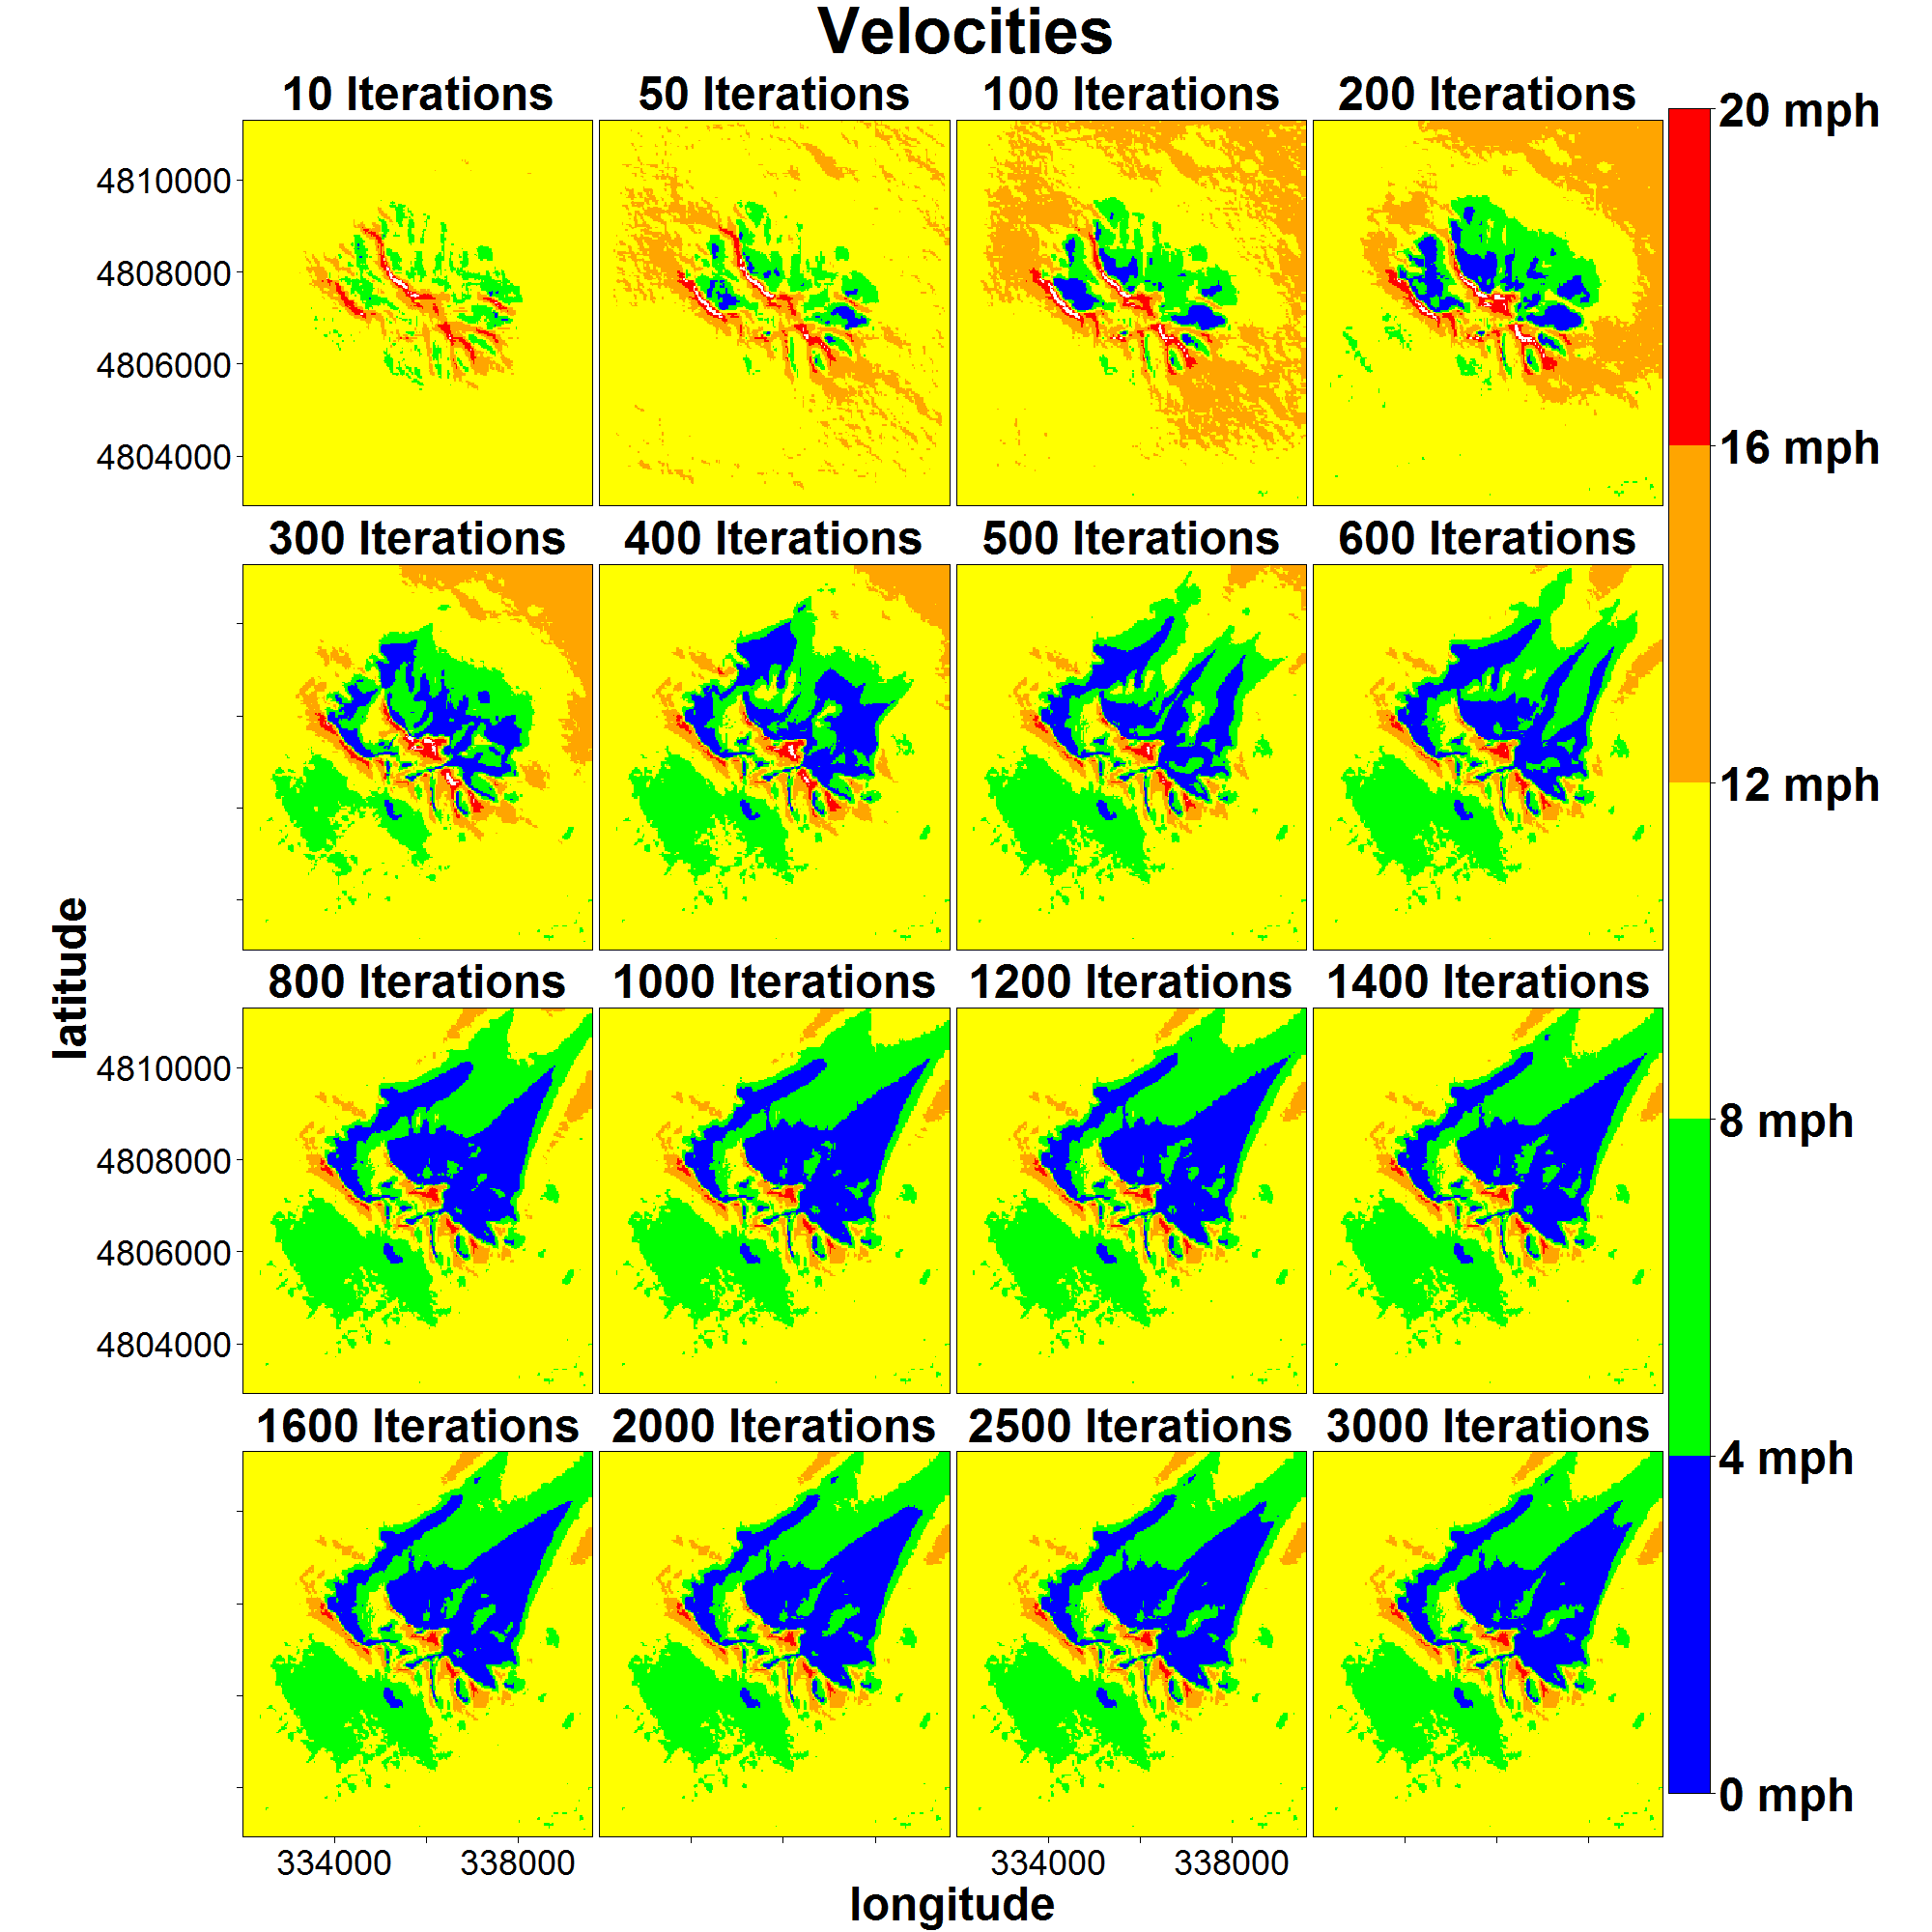
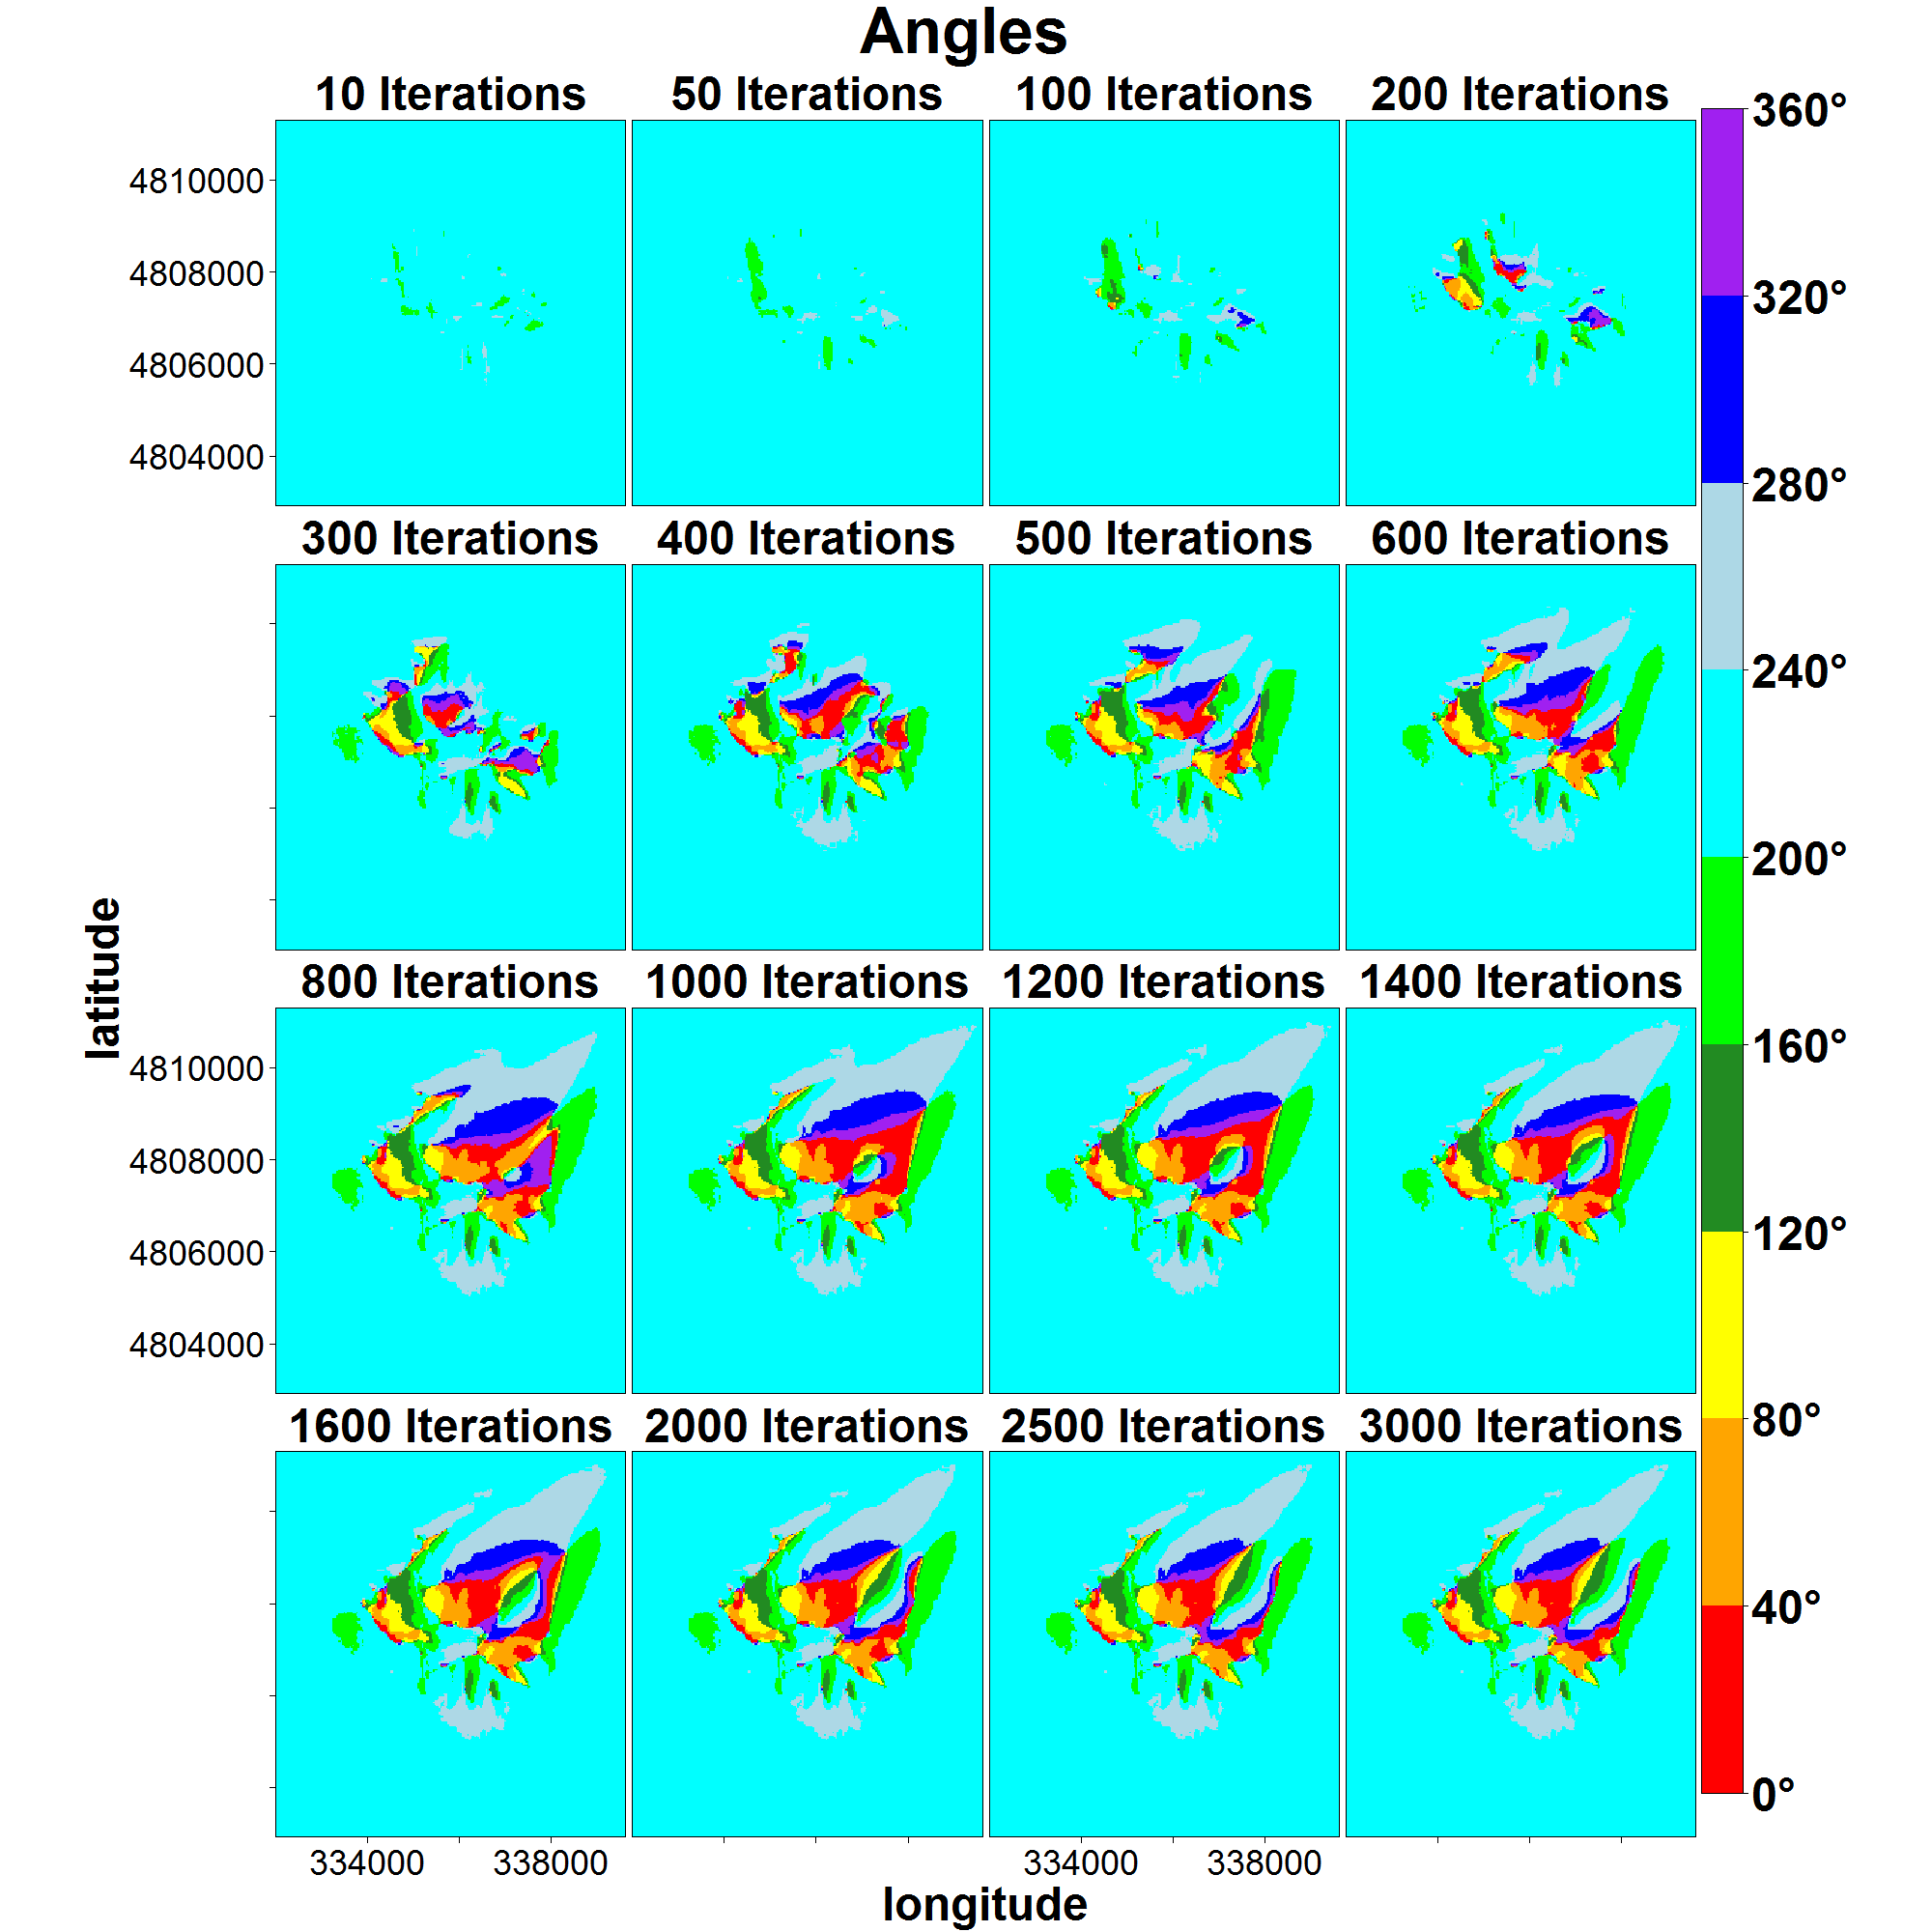
Velocity and Angle Plots: These plots are the direct values of wind velocity and wind direction from WindNinja's resulting .asc files. The velocity colors are very similar to the colors seen in WindNinja's .kmz files. The angle colors were chosen to be able to see all the different types of directions all at once. These plots are handy for directly knowing what WindNinja's results look like.
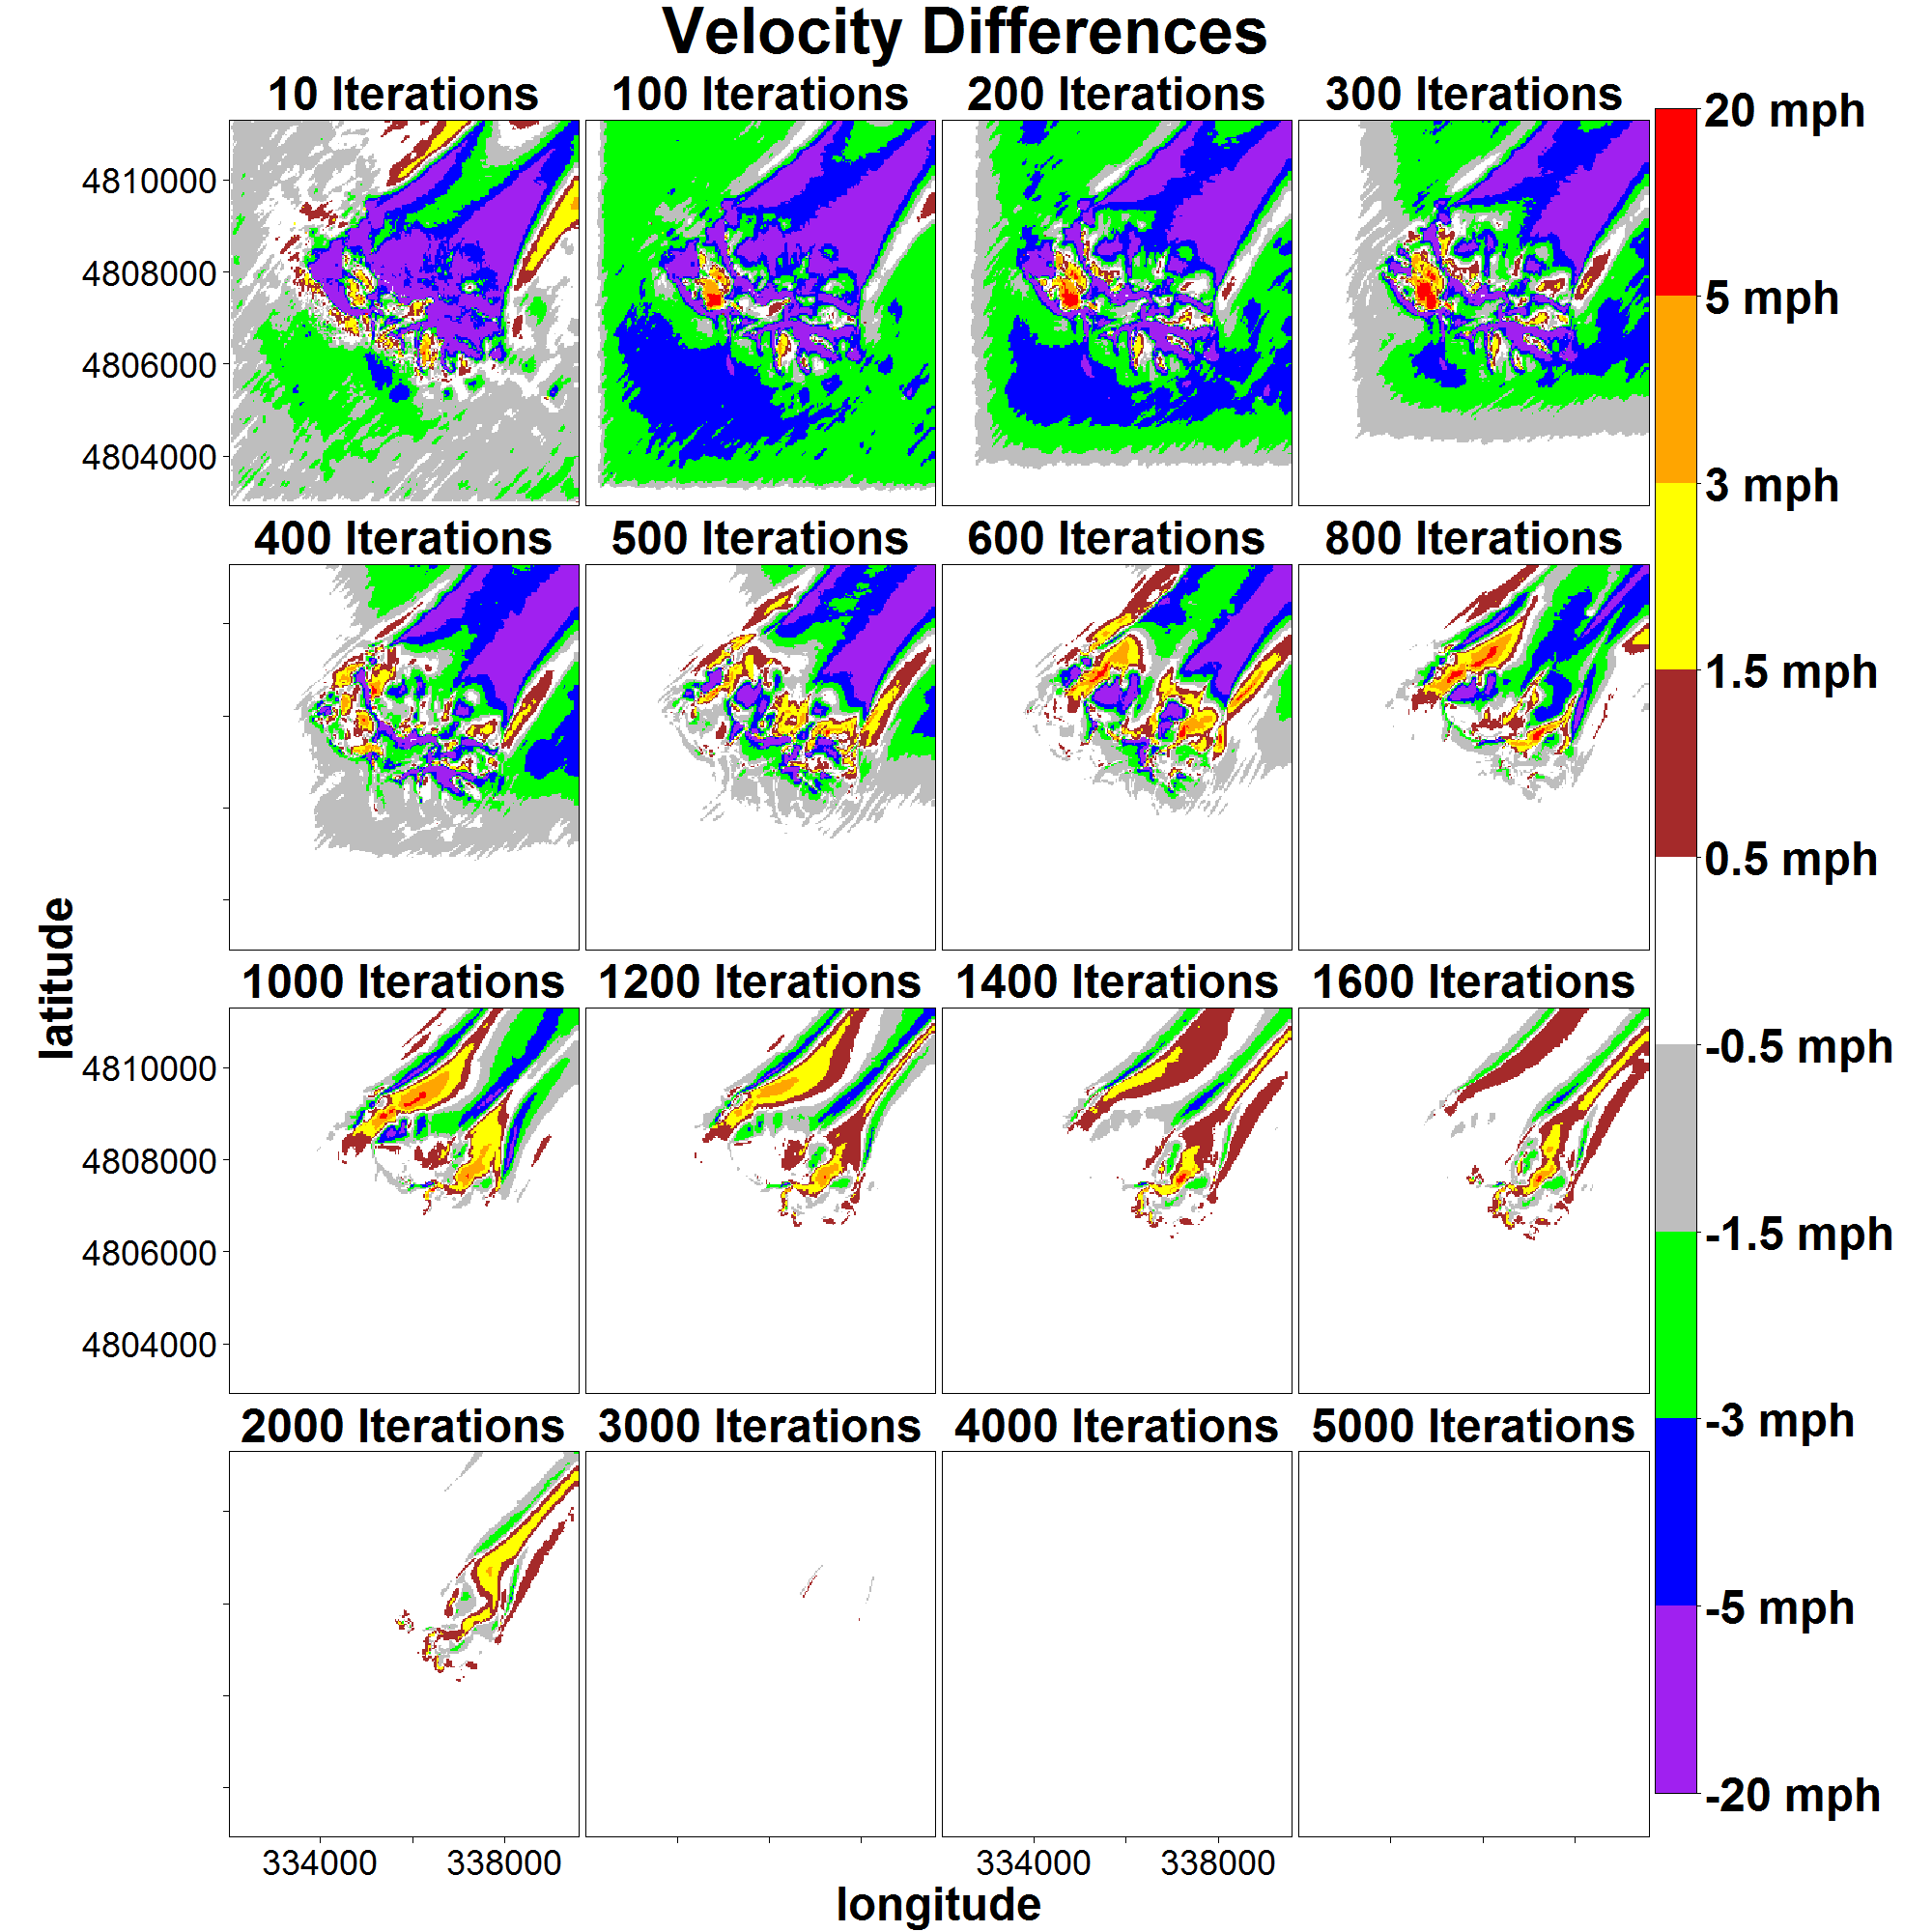
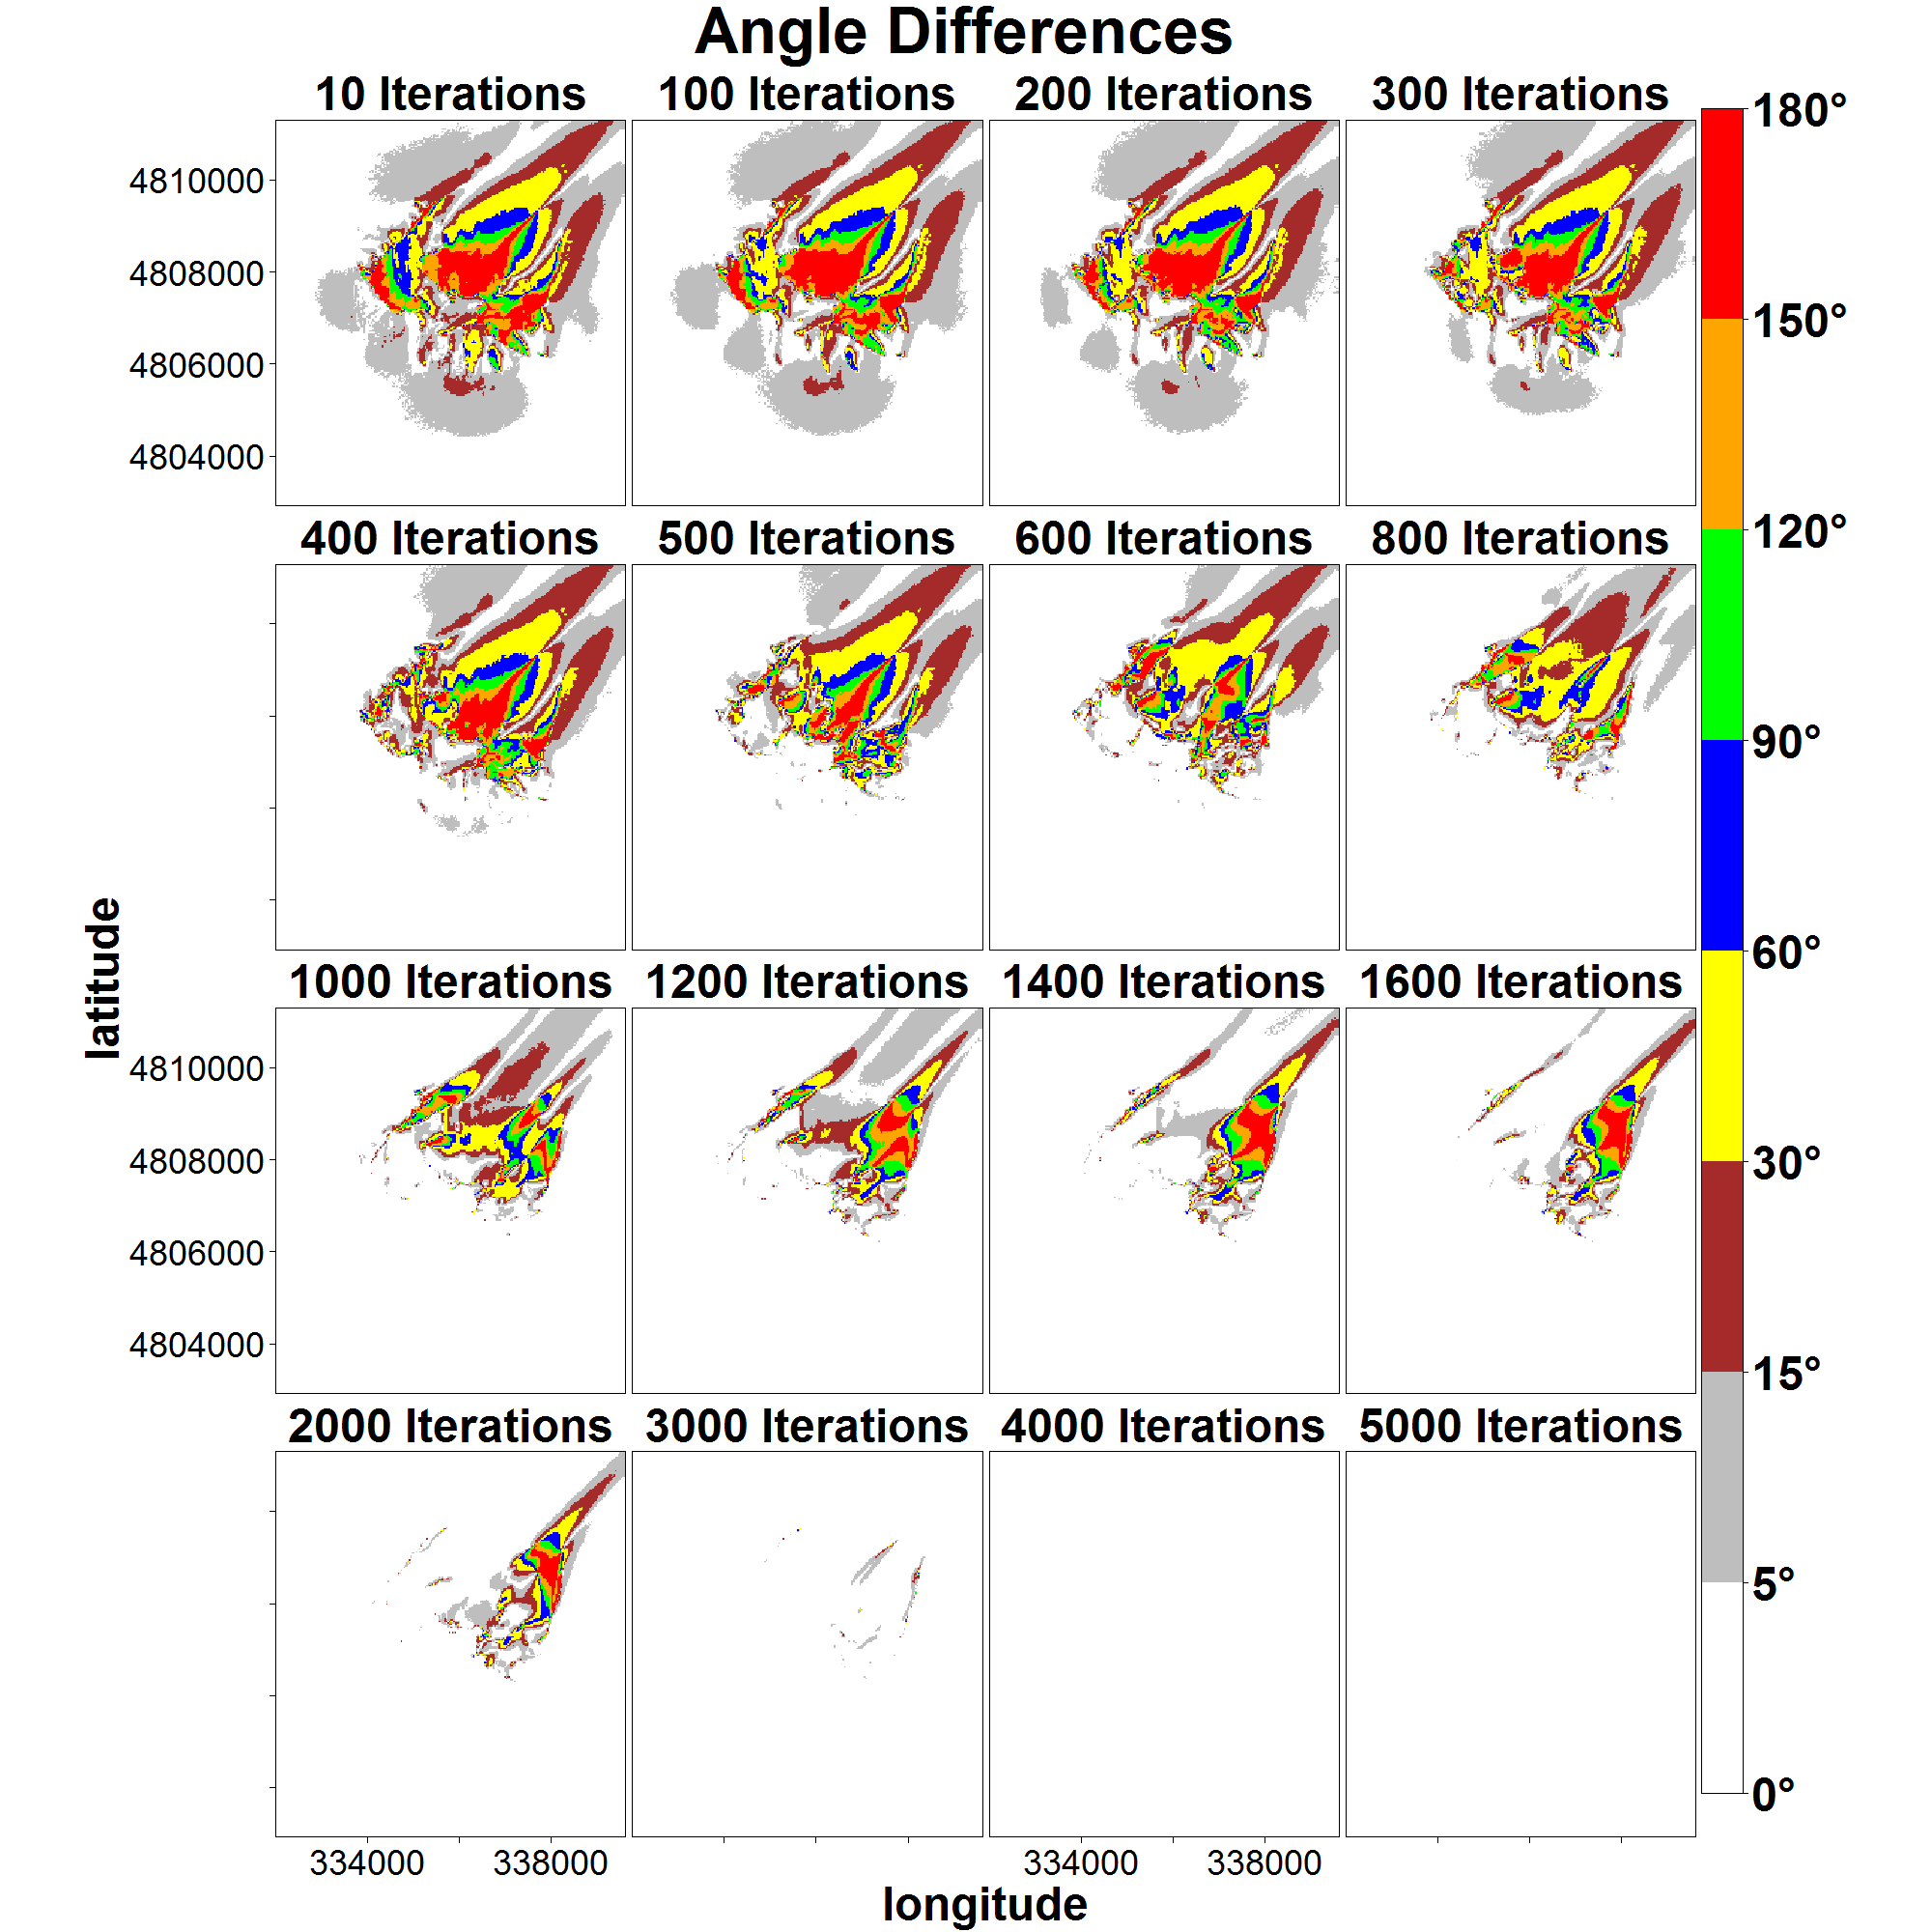
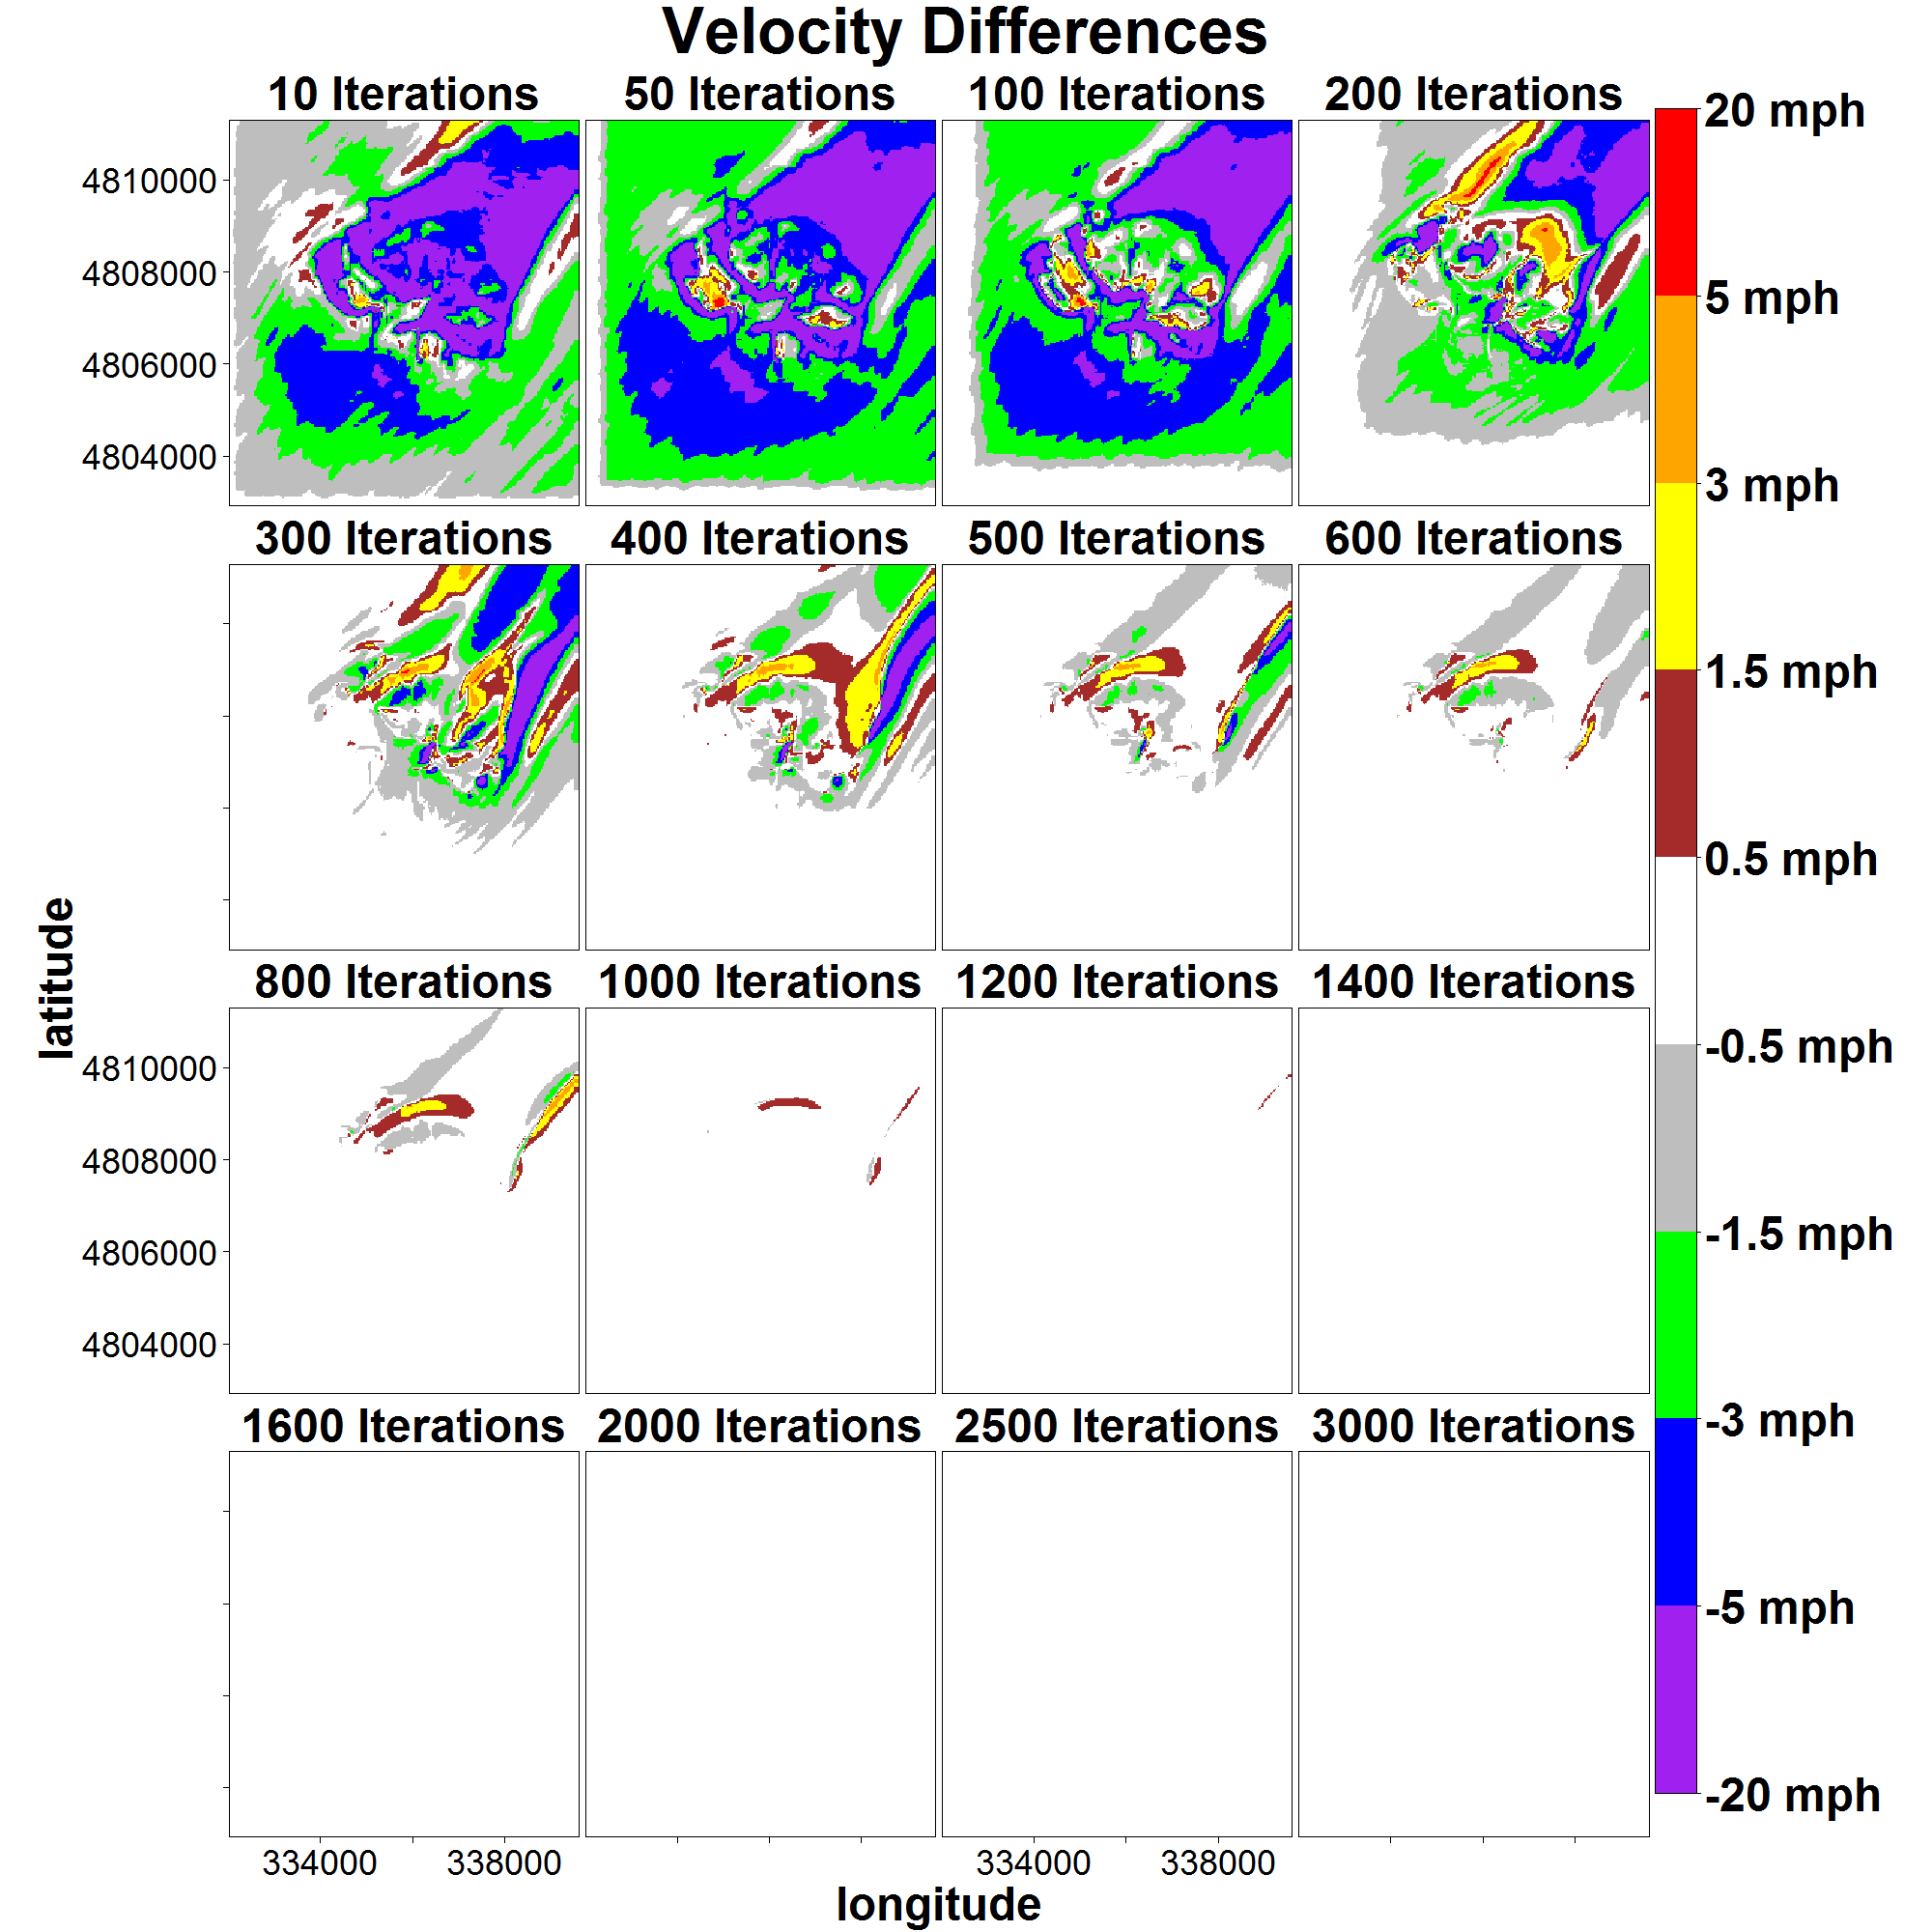
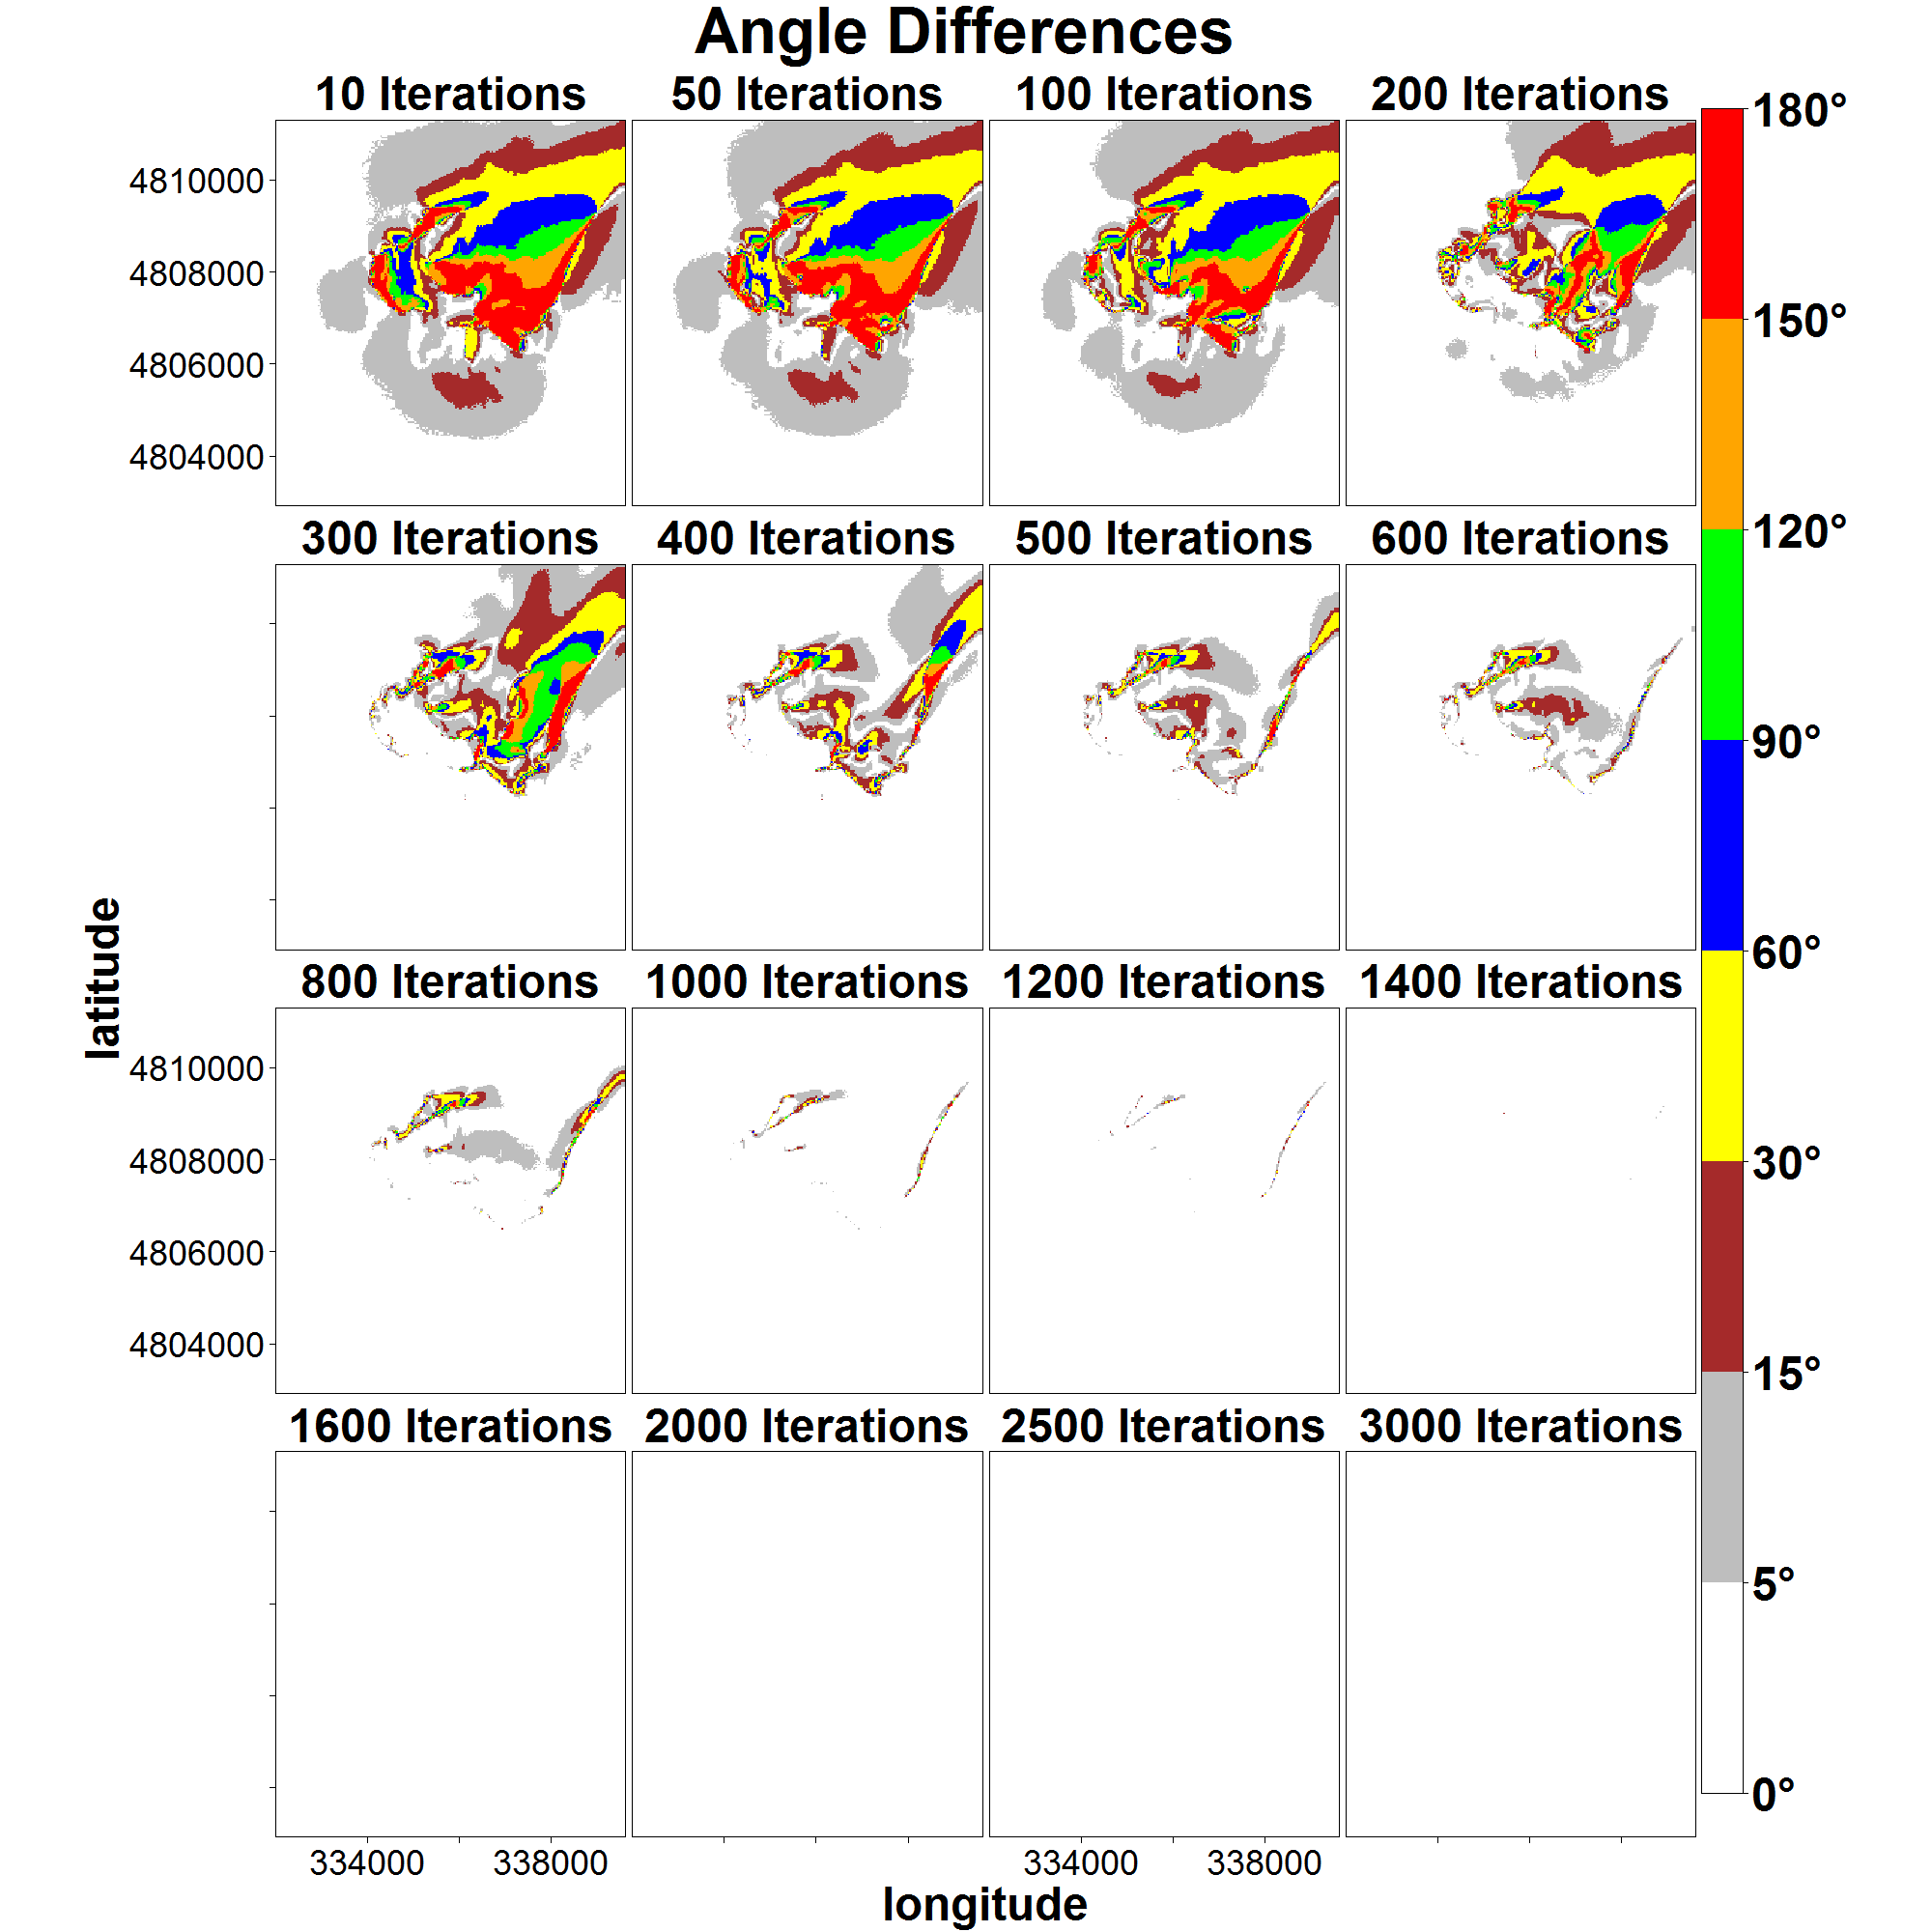
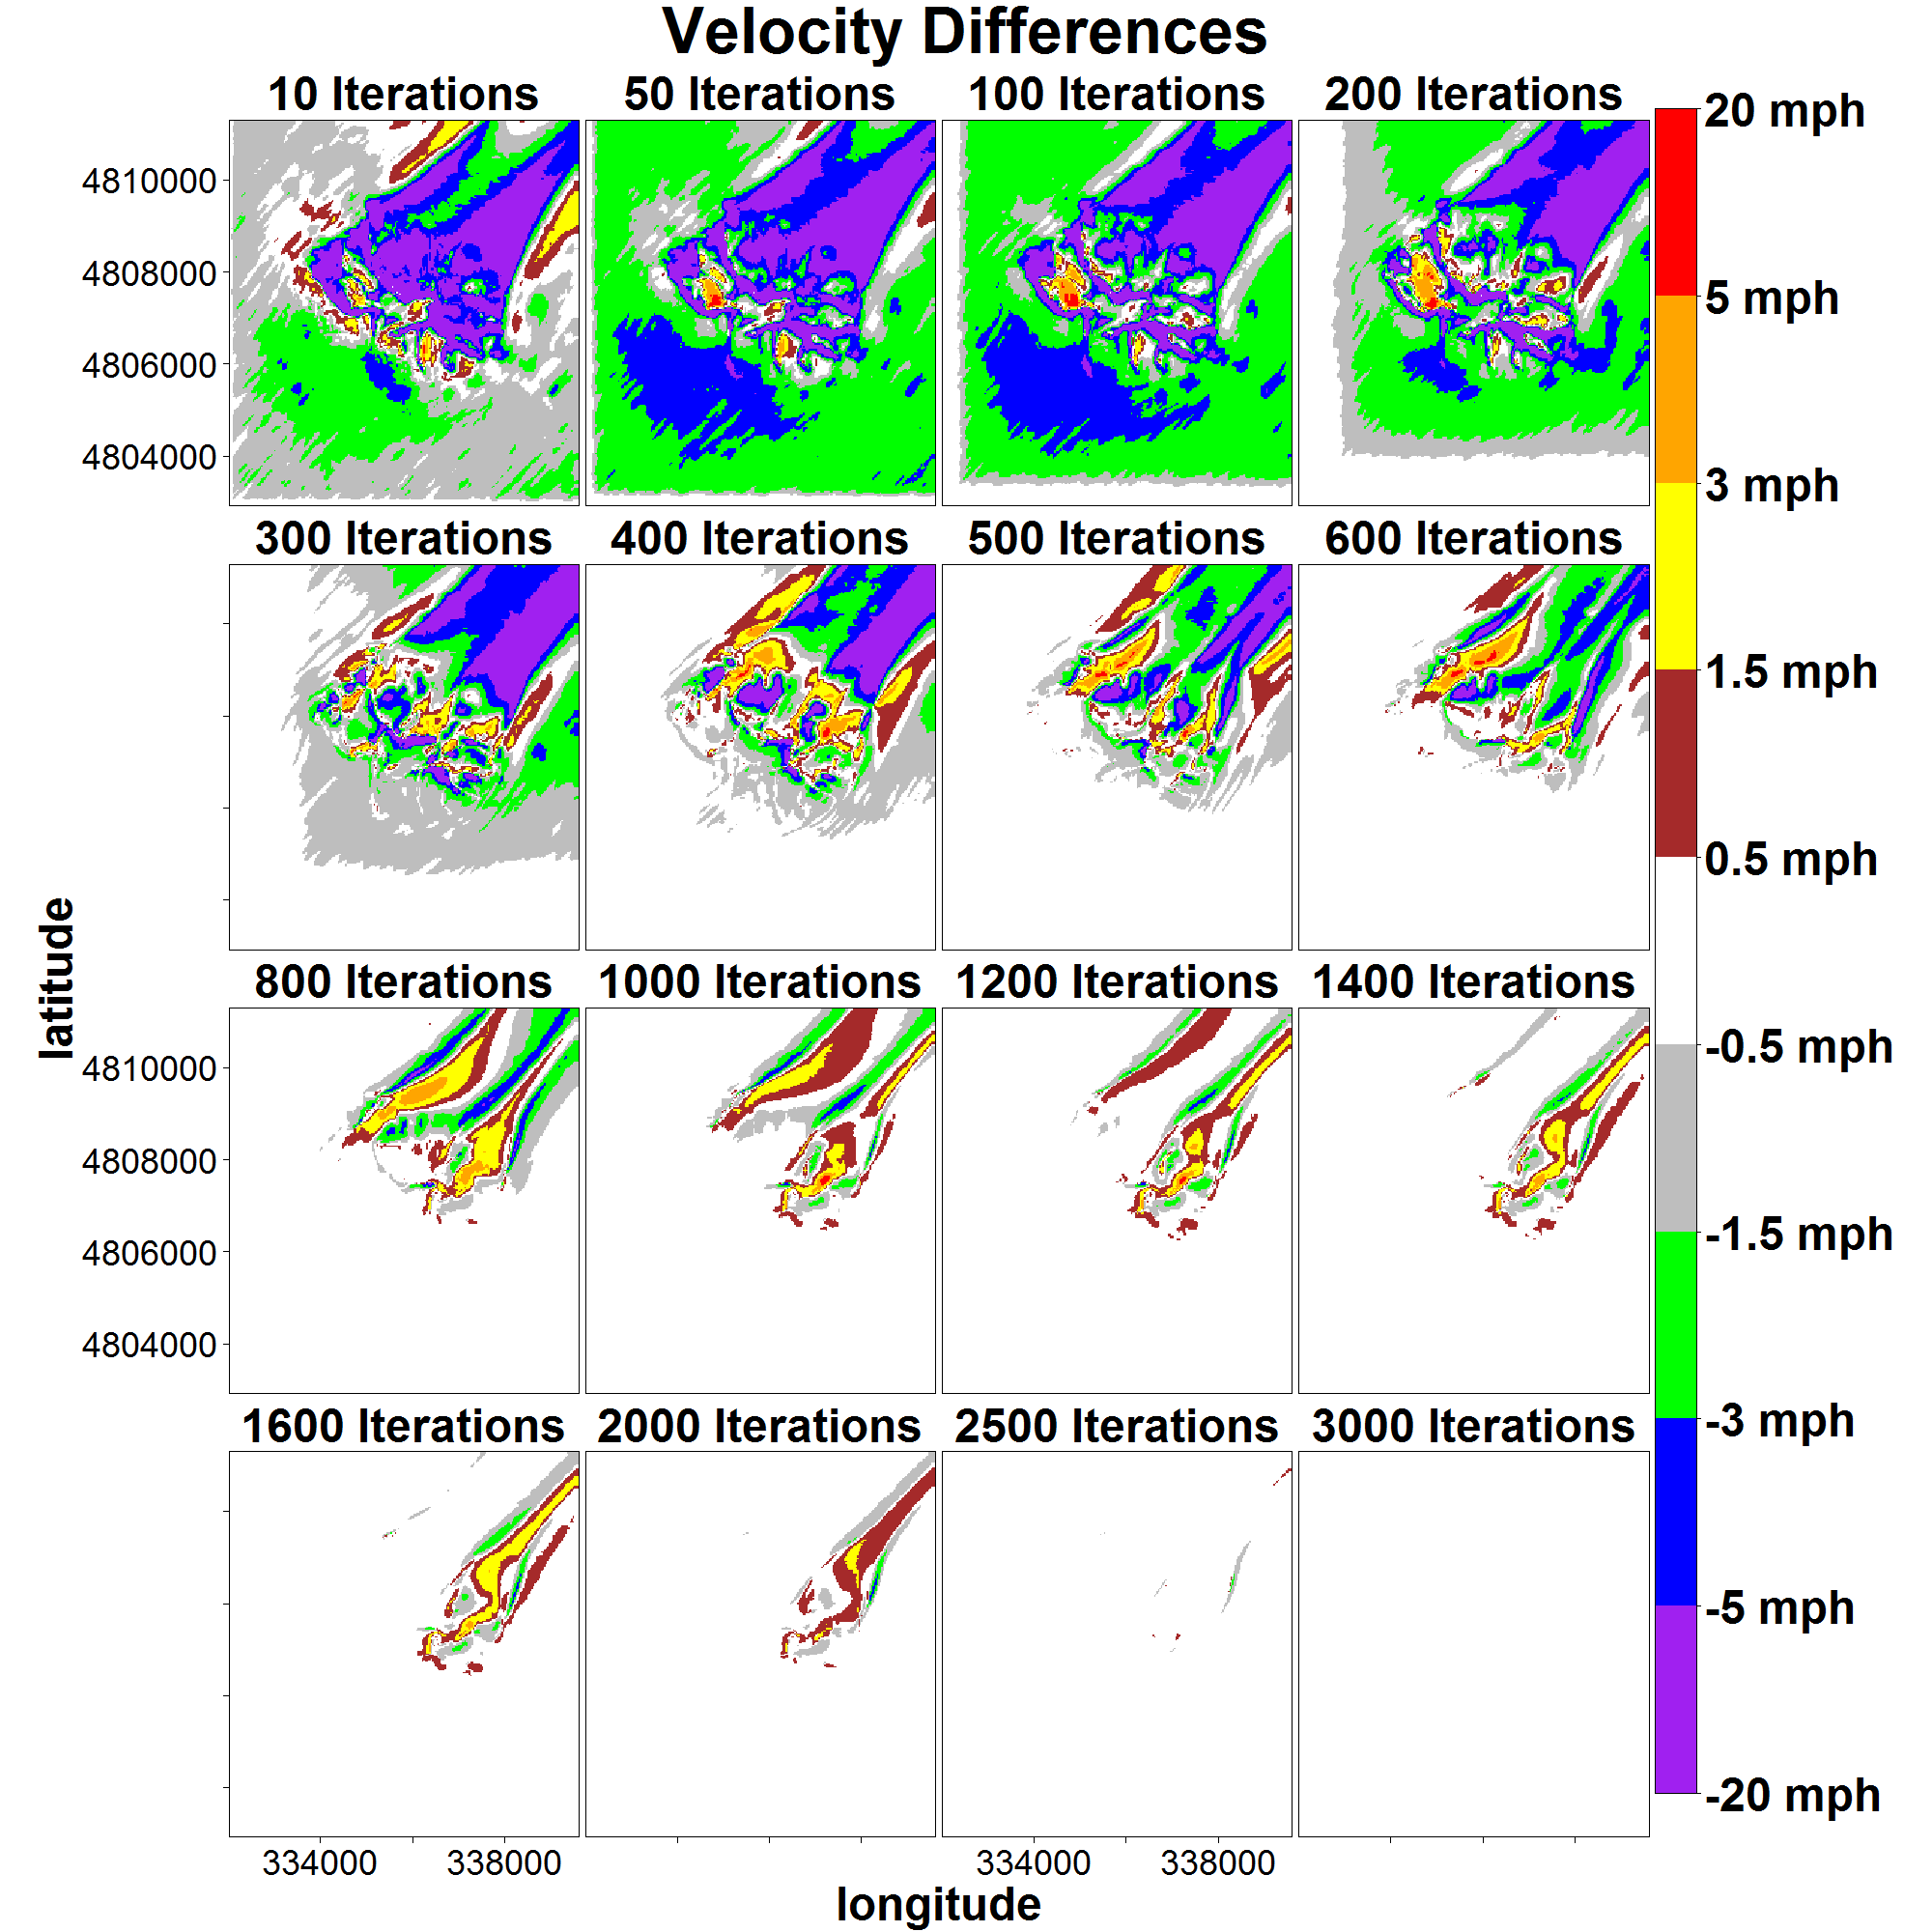
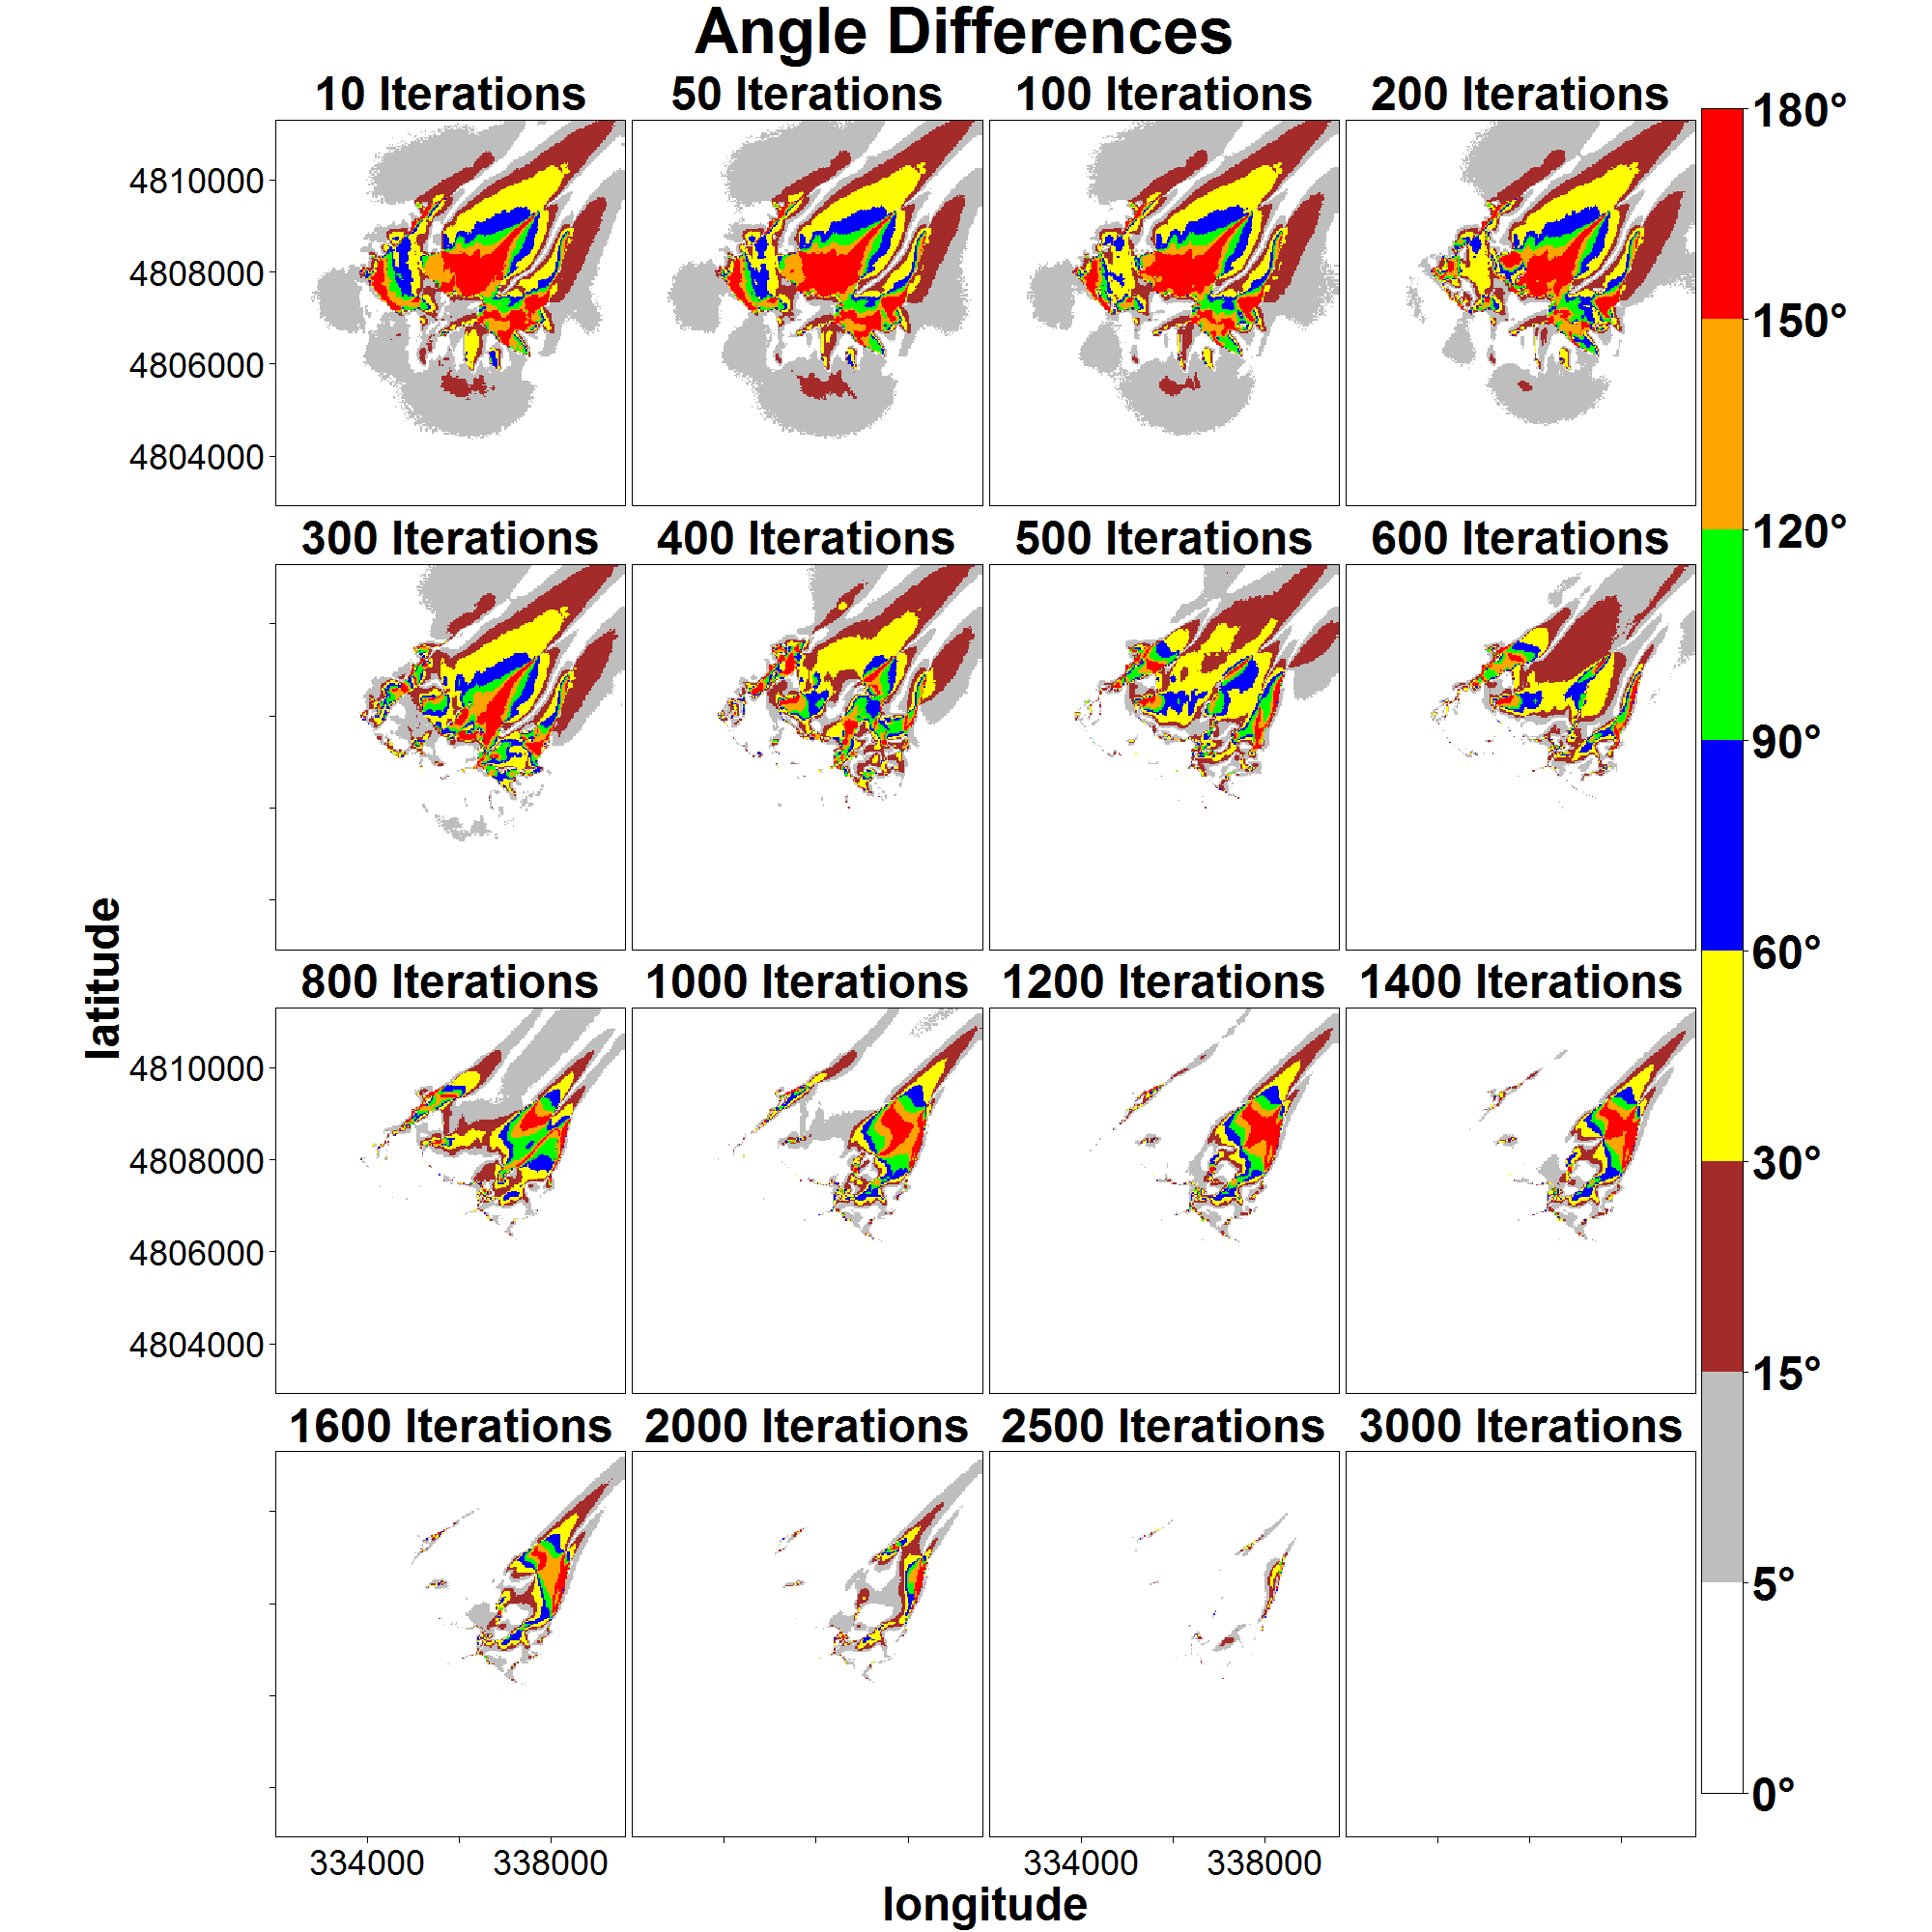
Velocity Difference and Angle Difference Plots: These plots are the most useful of the plots. They were obtained by taking the values of all the velocities and angles of a single iteration and subtracting them from all the velocities and angles of the converged solution. It makes it really easy to see the progress of convergence with increasing the number of iterations. Comparing these plots with the angle and velocity plots is also handy for determining where recirculation zones occur.
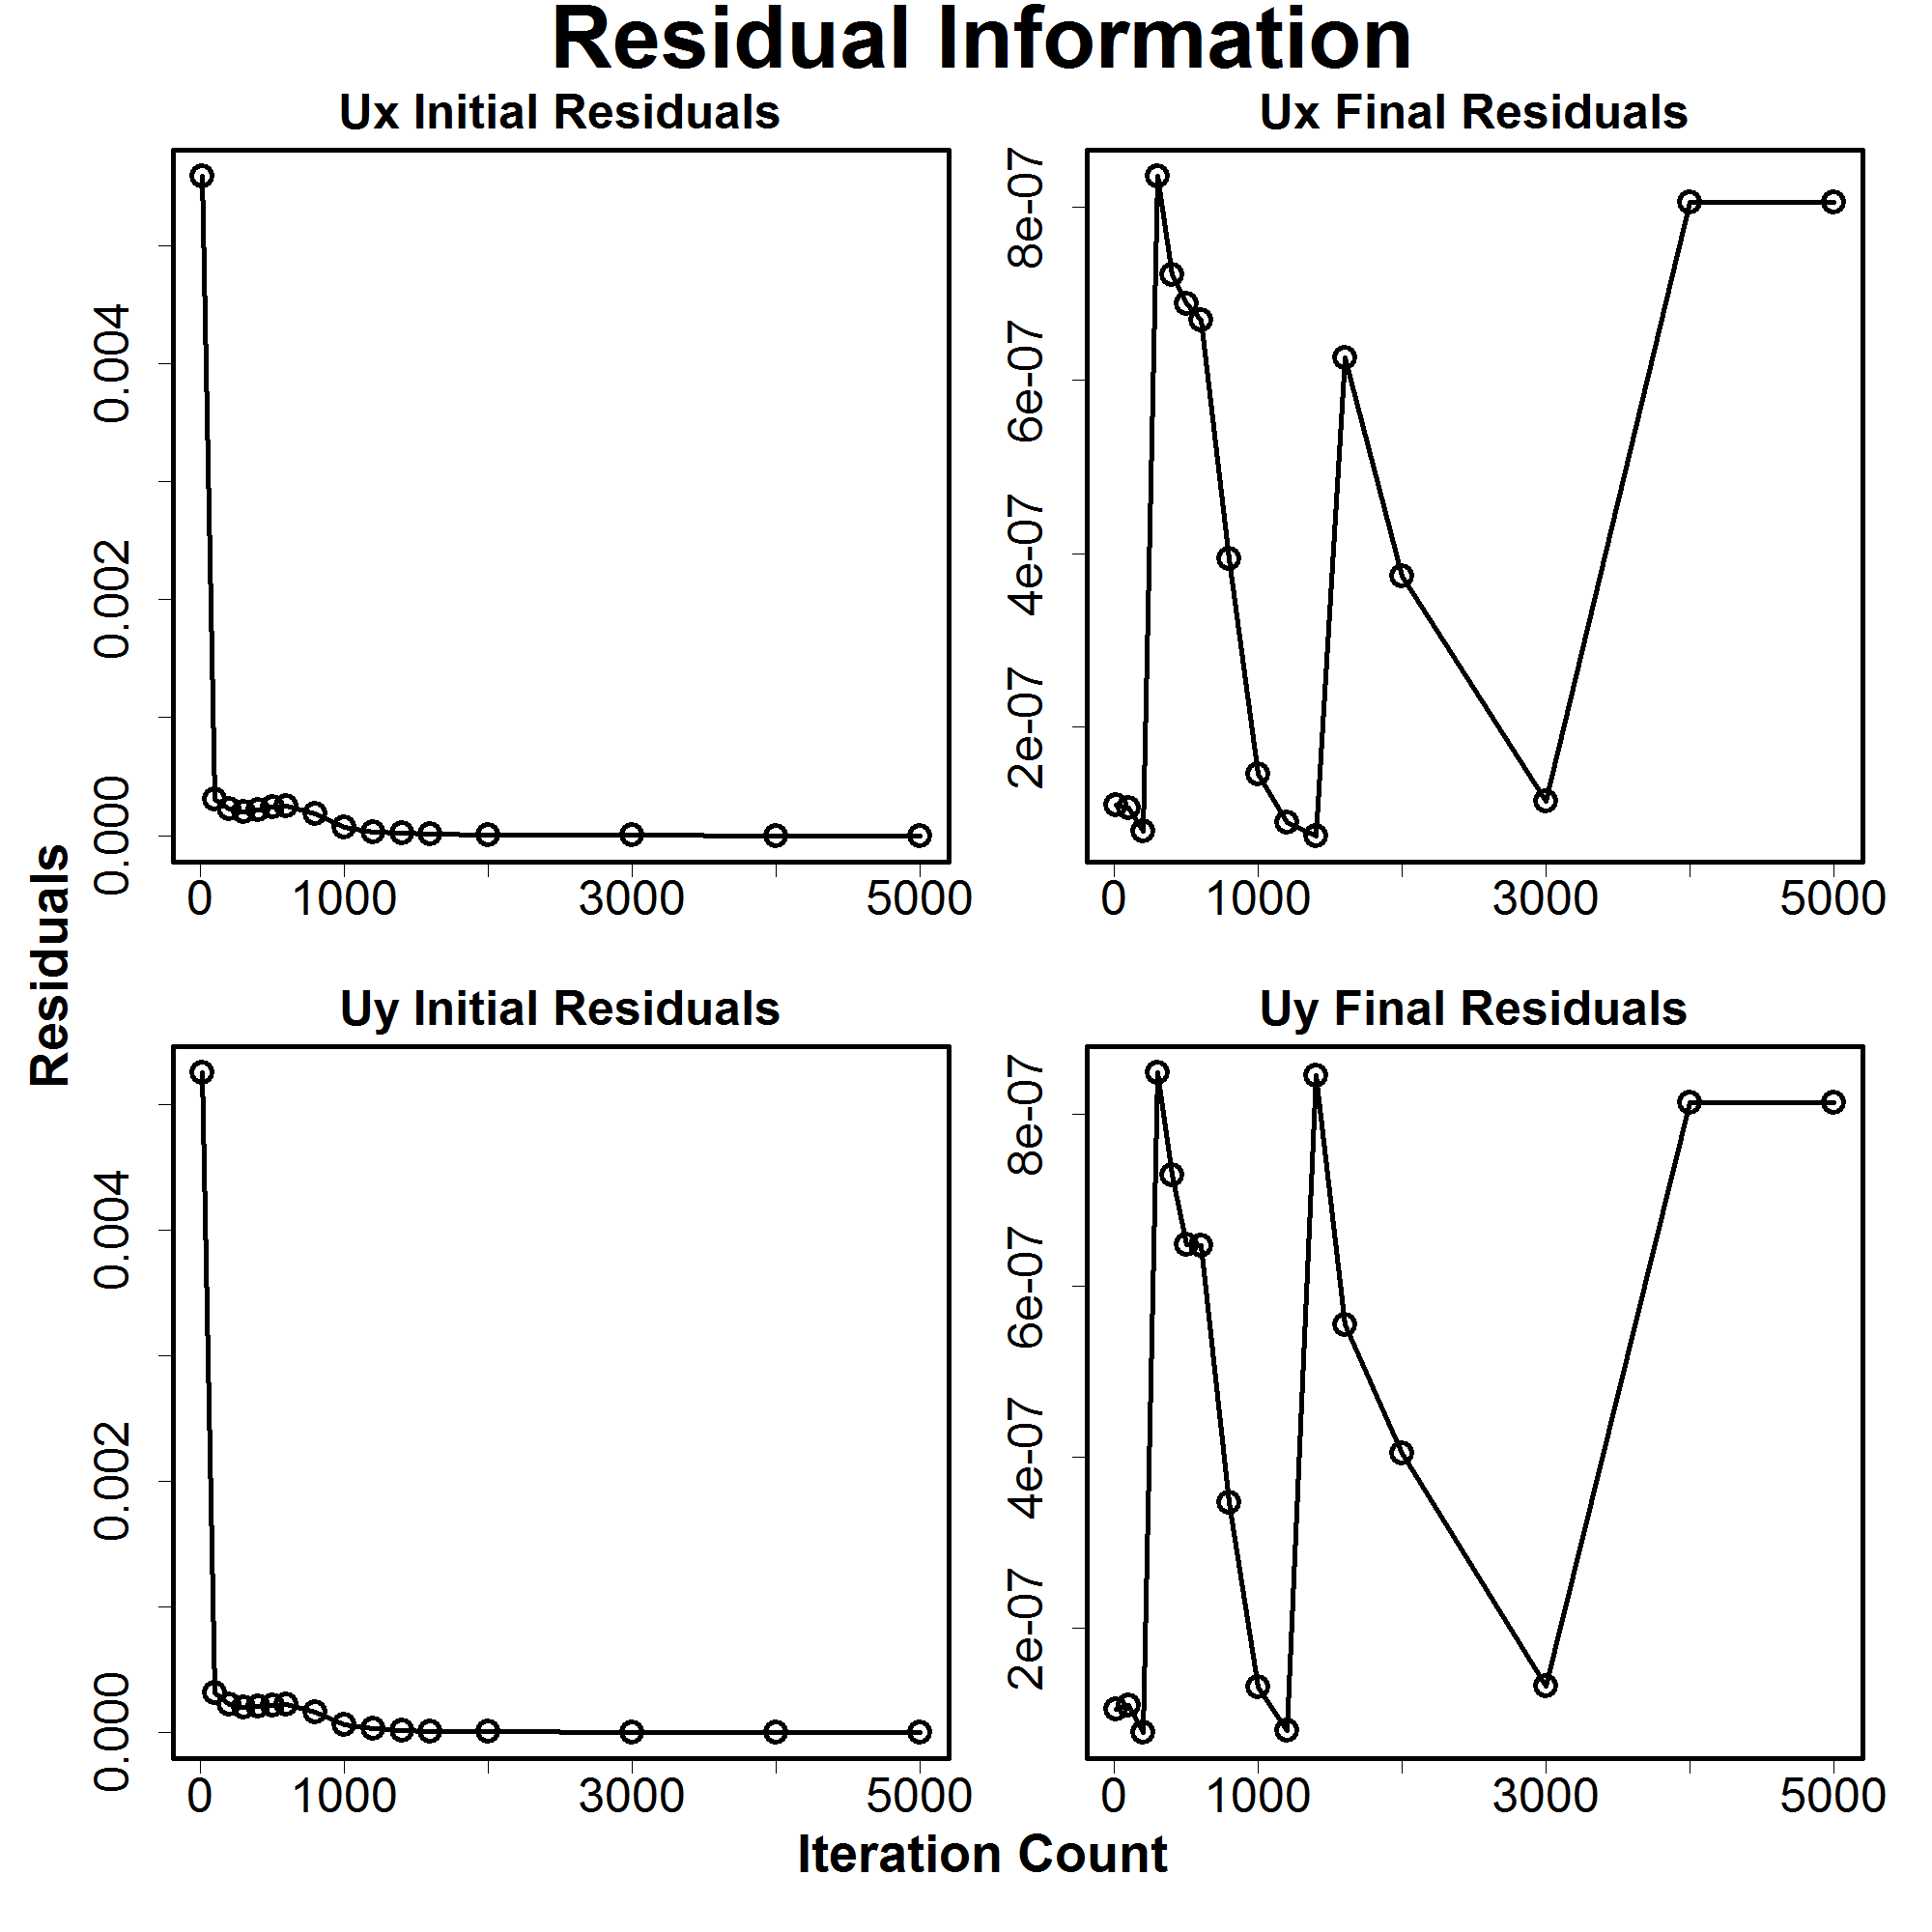
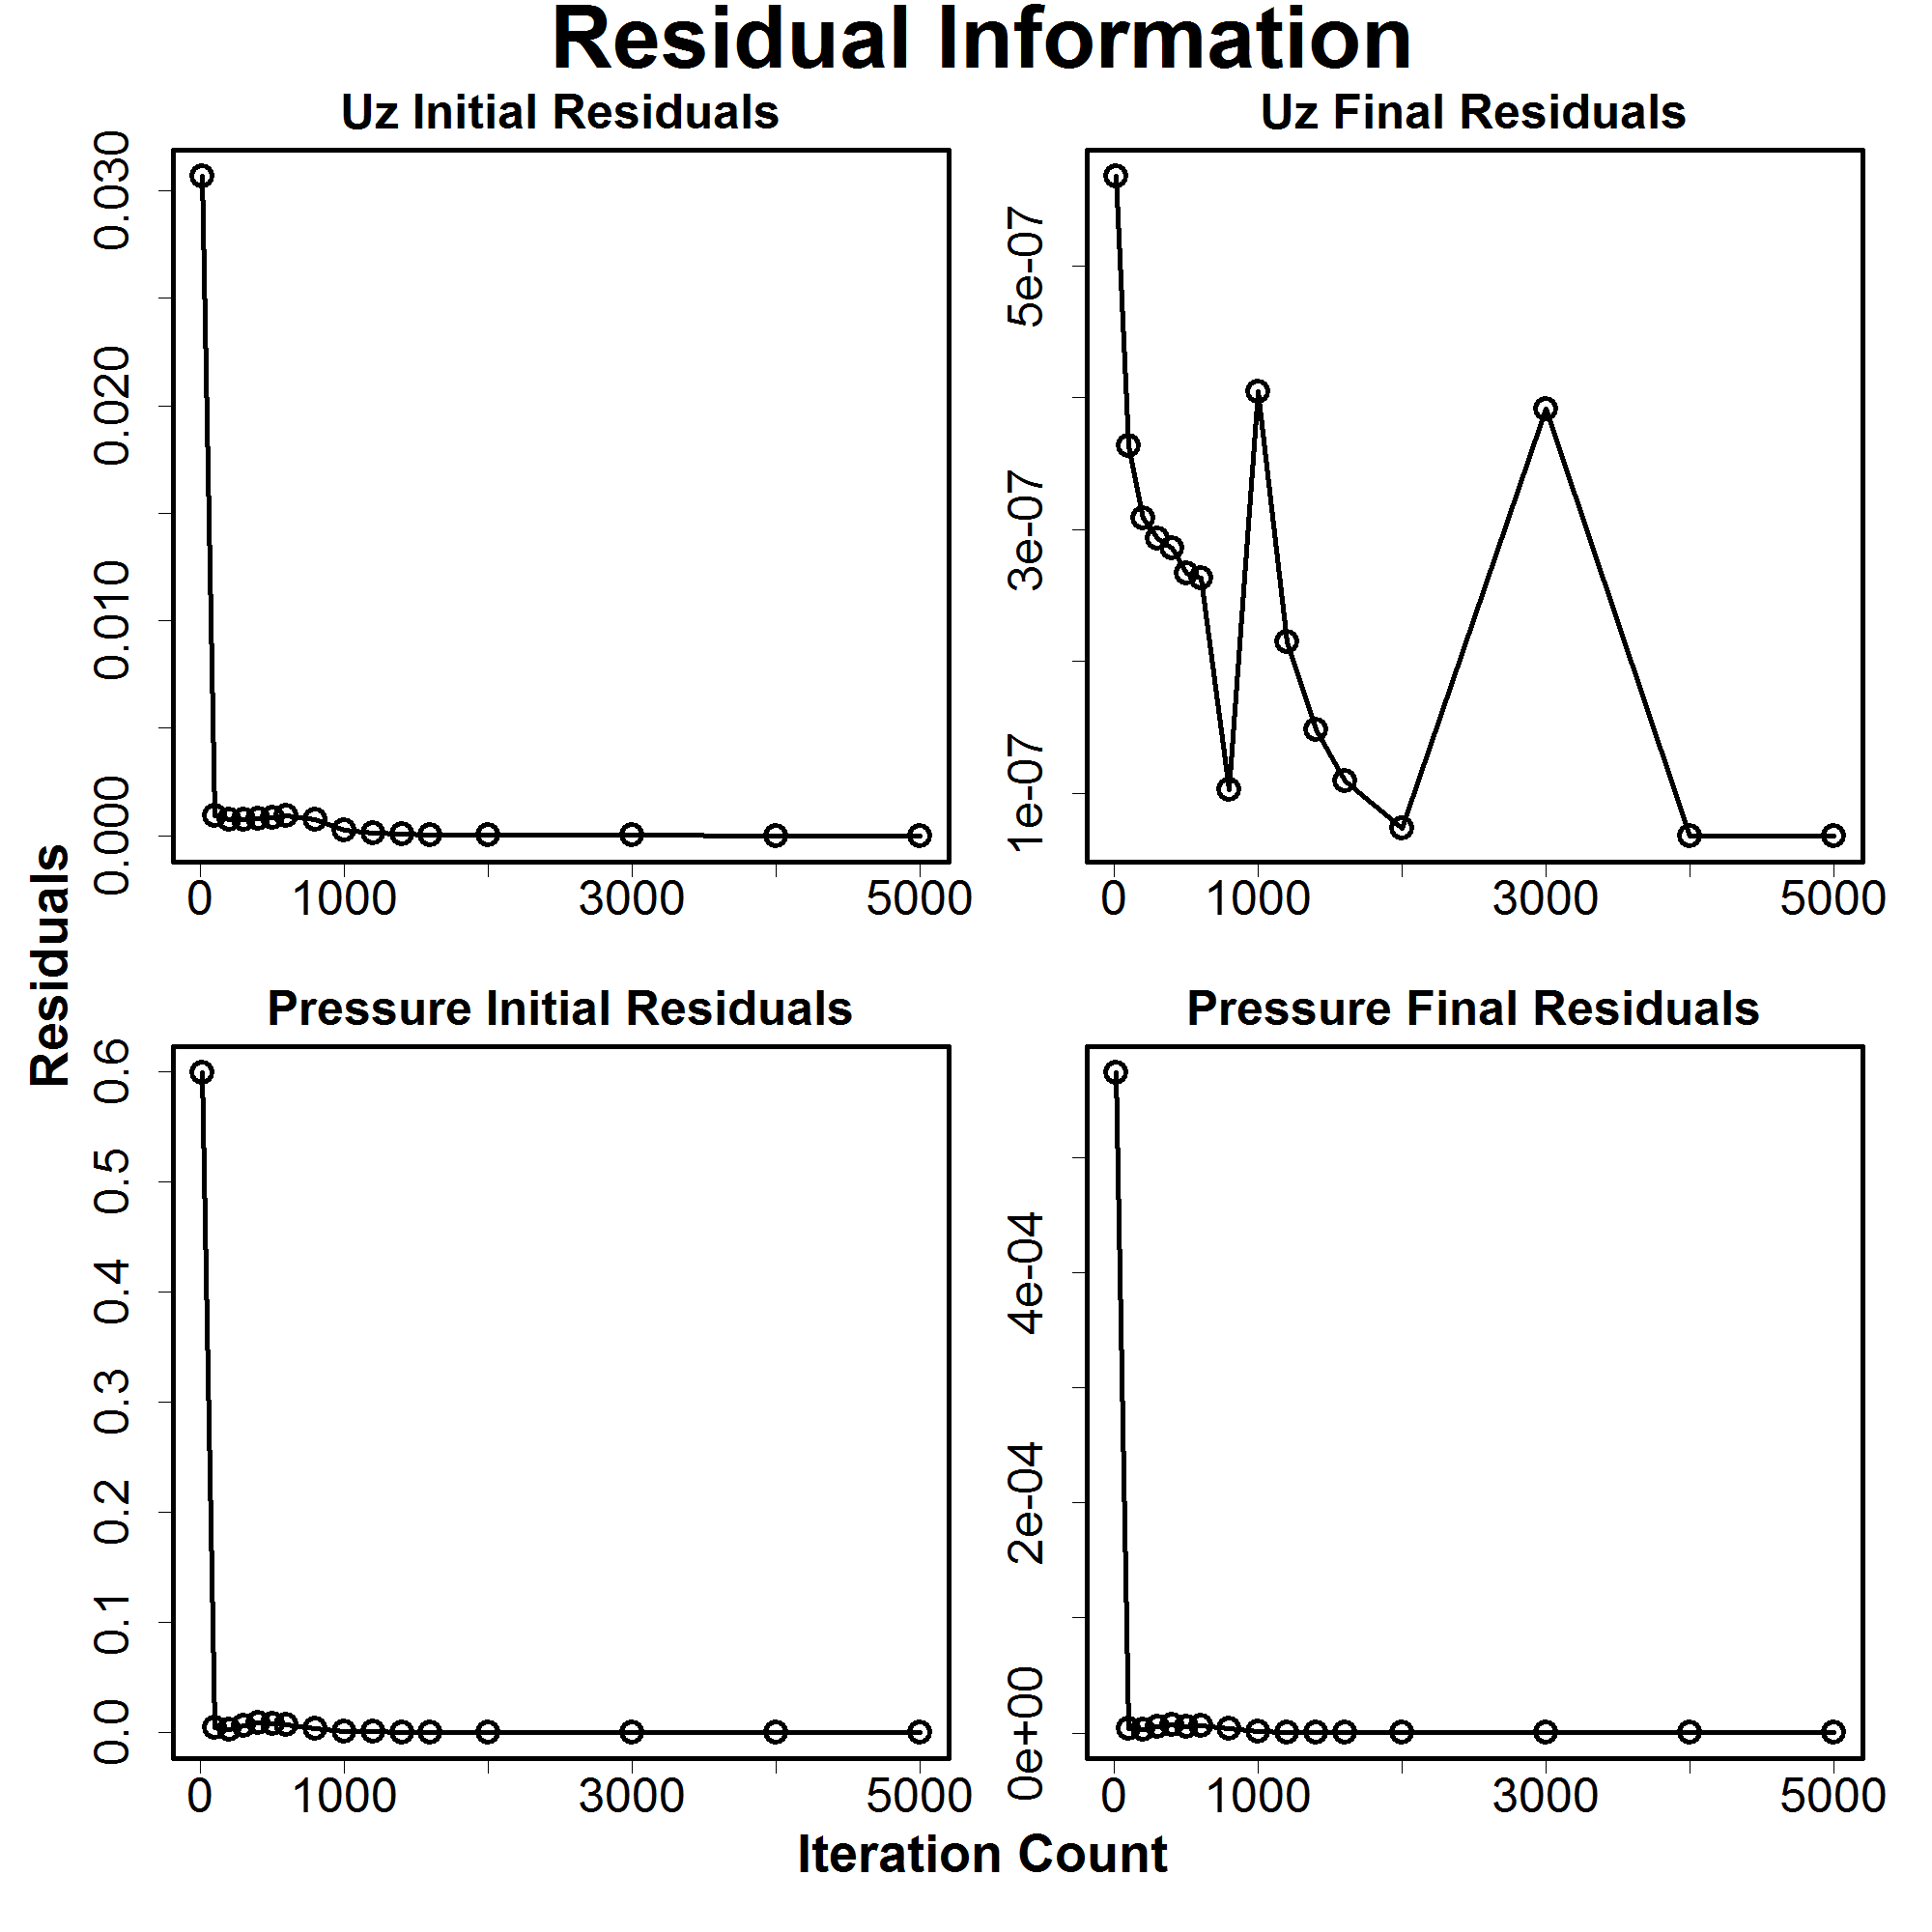
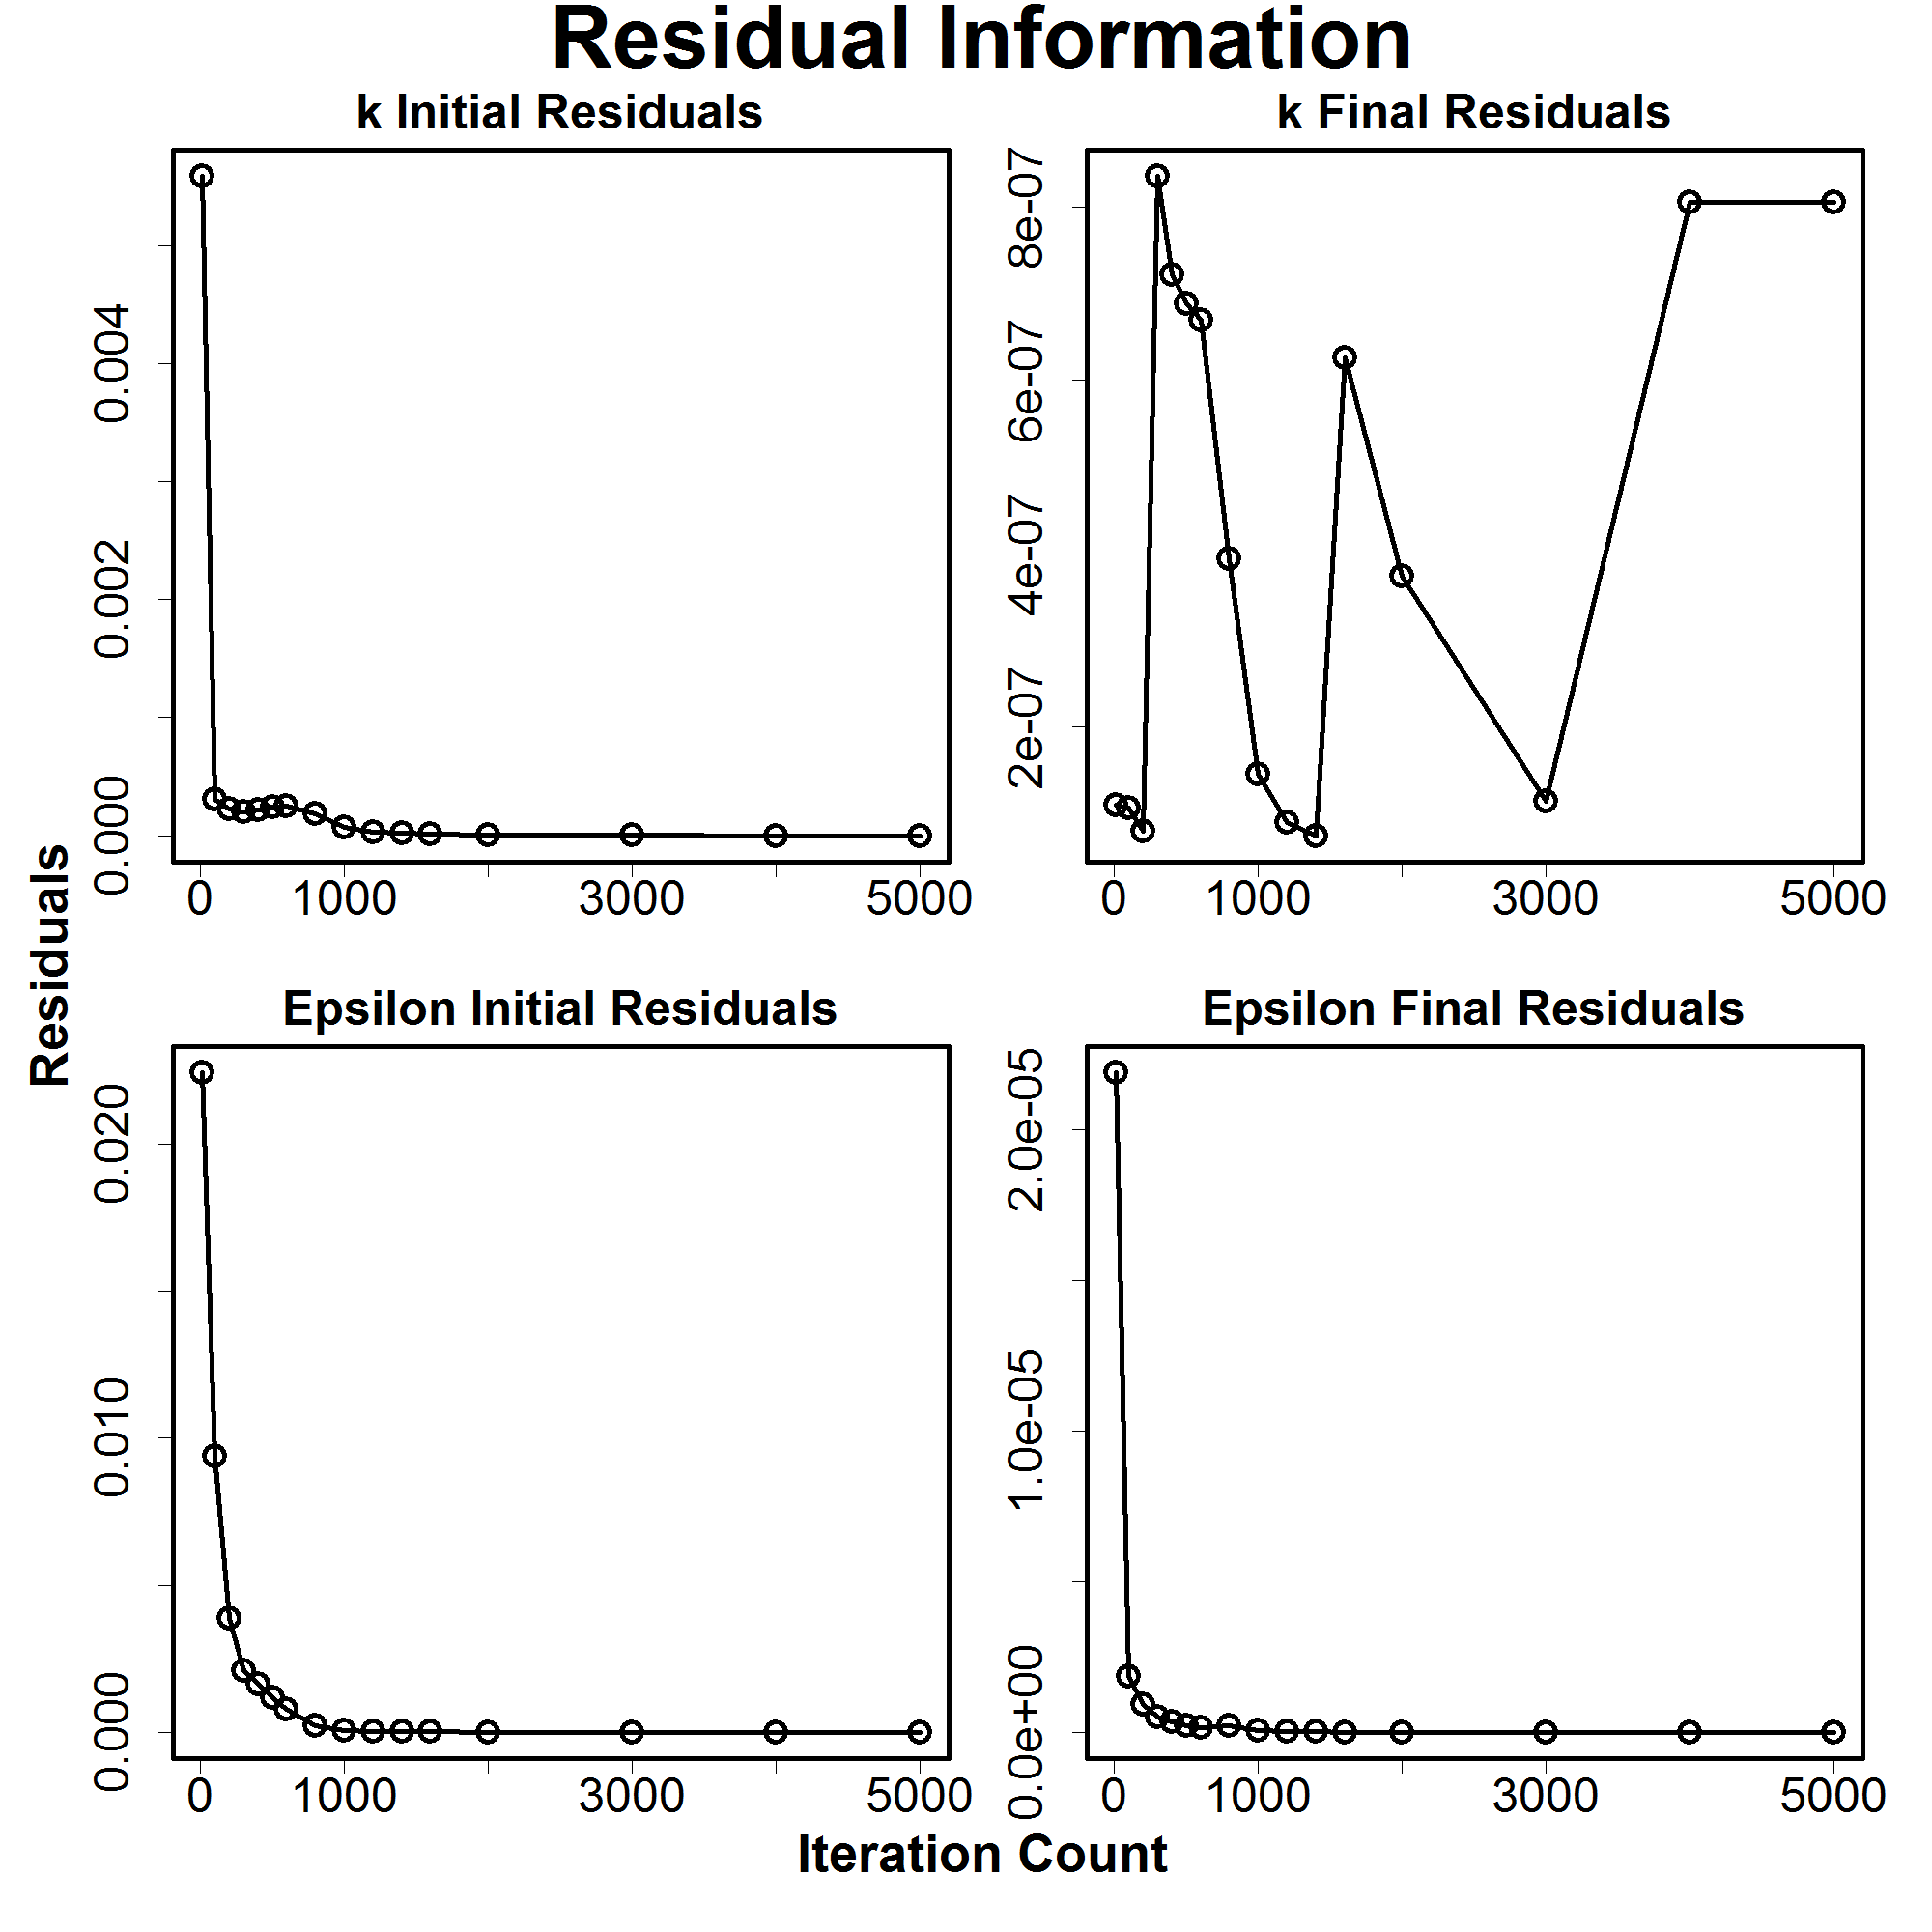
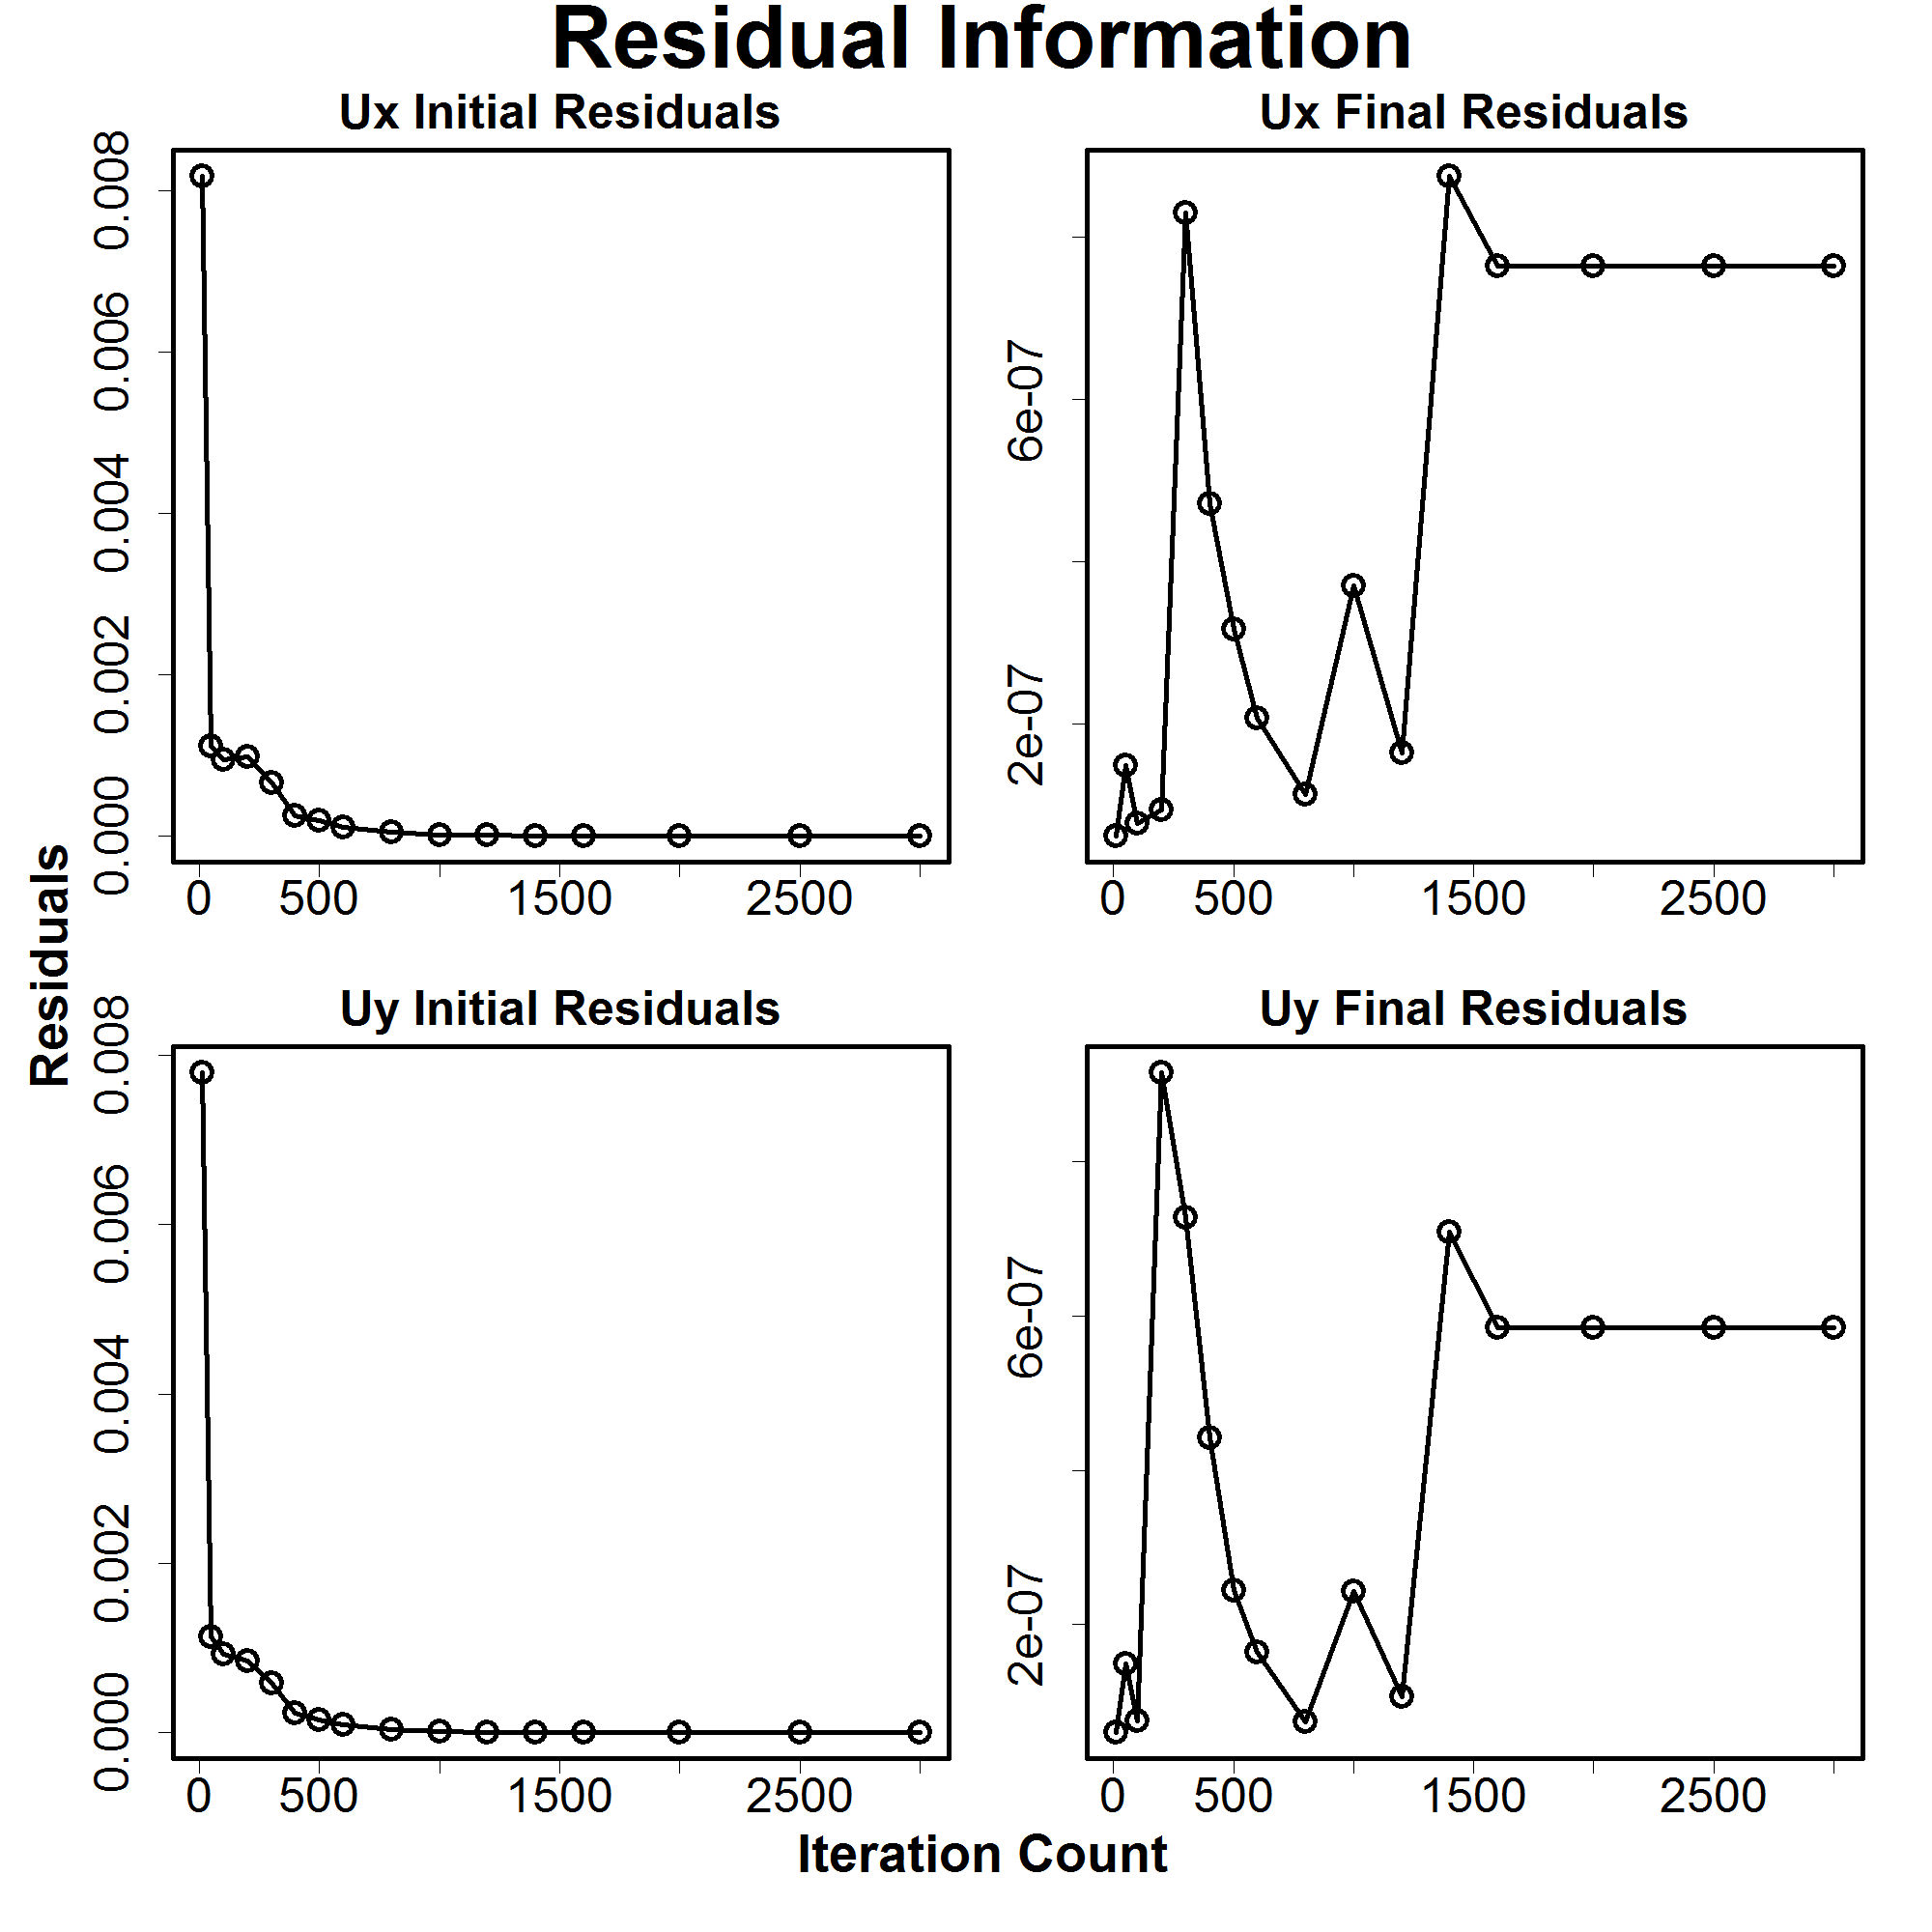
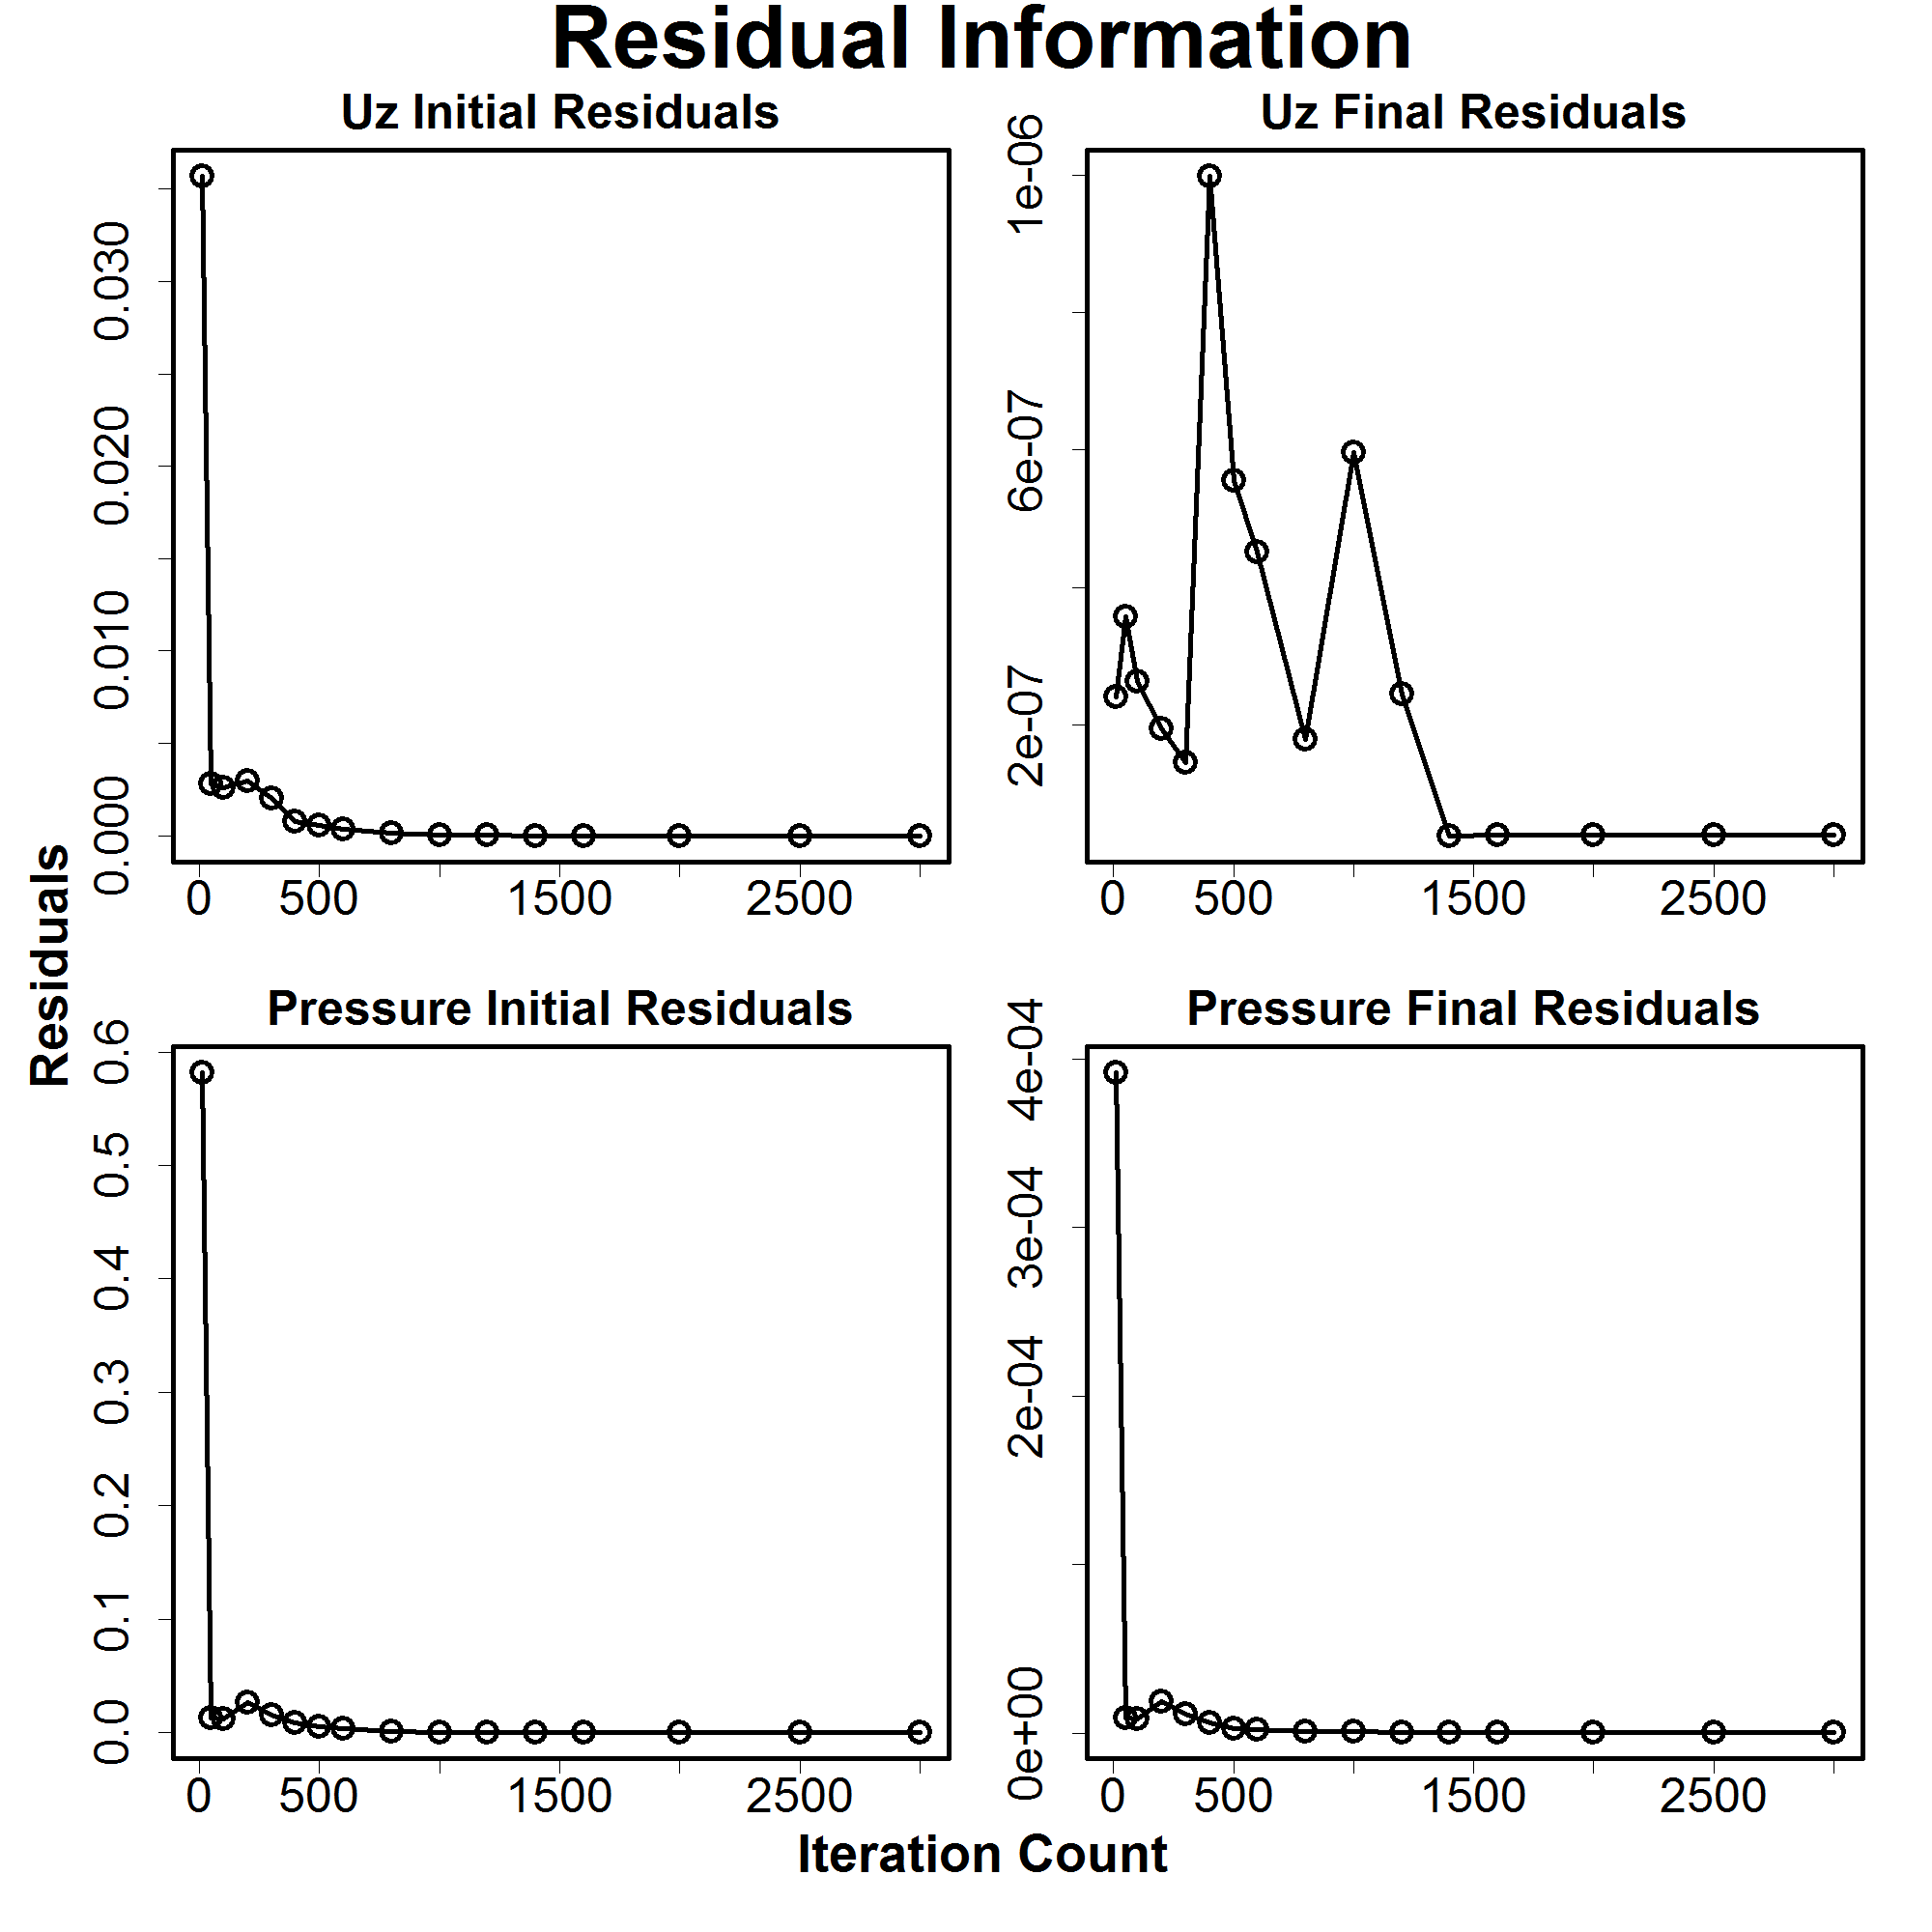
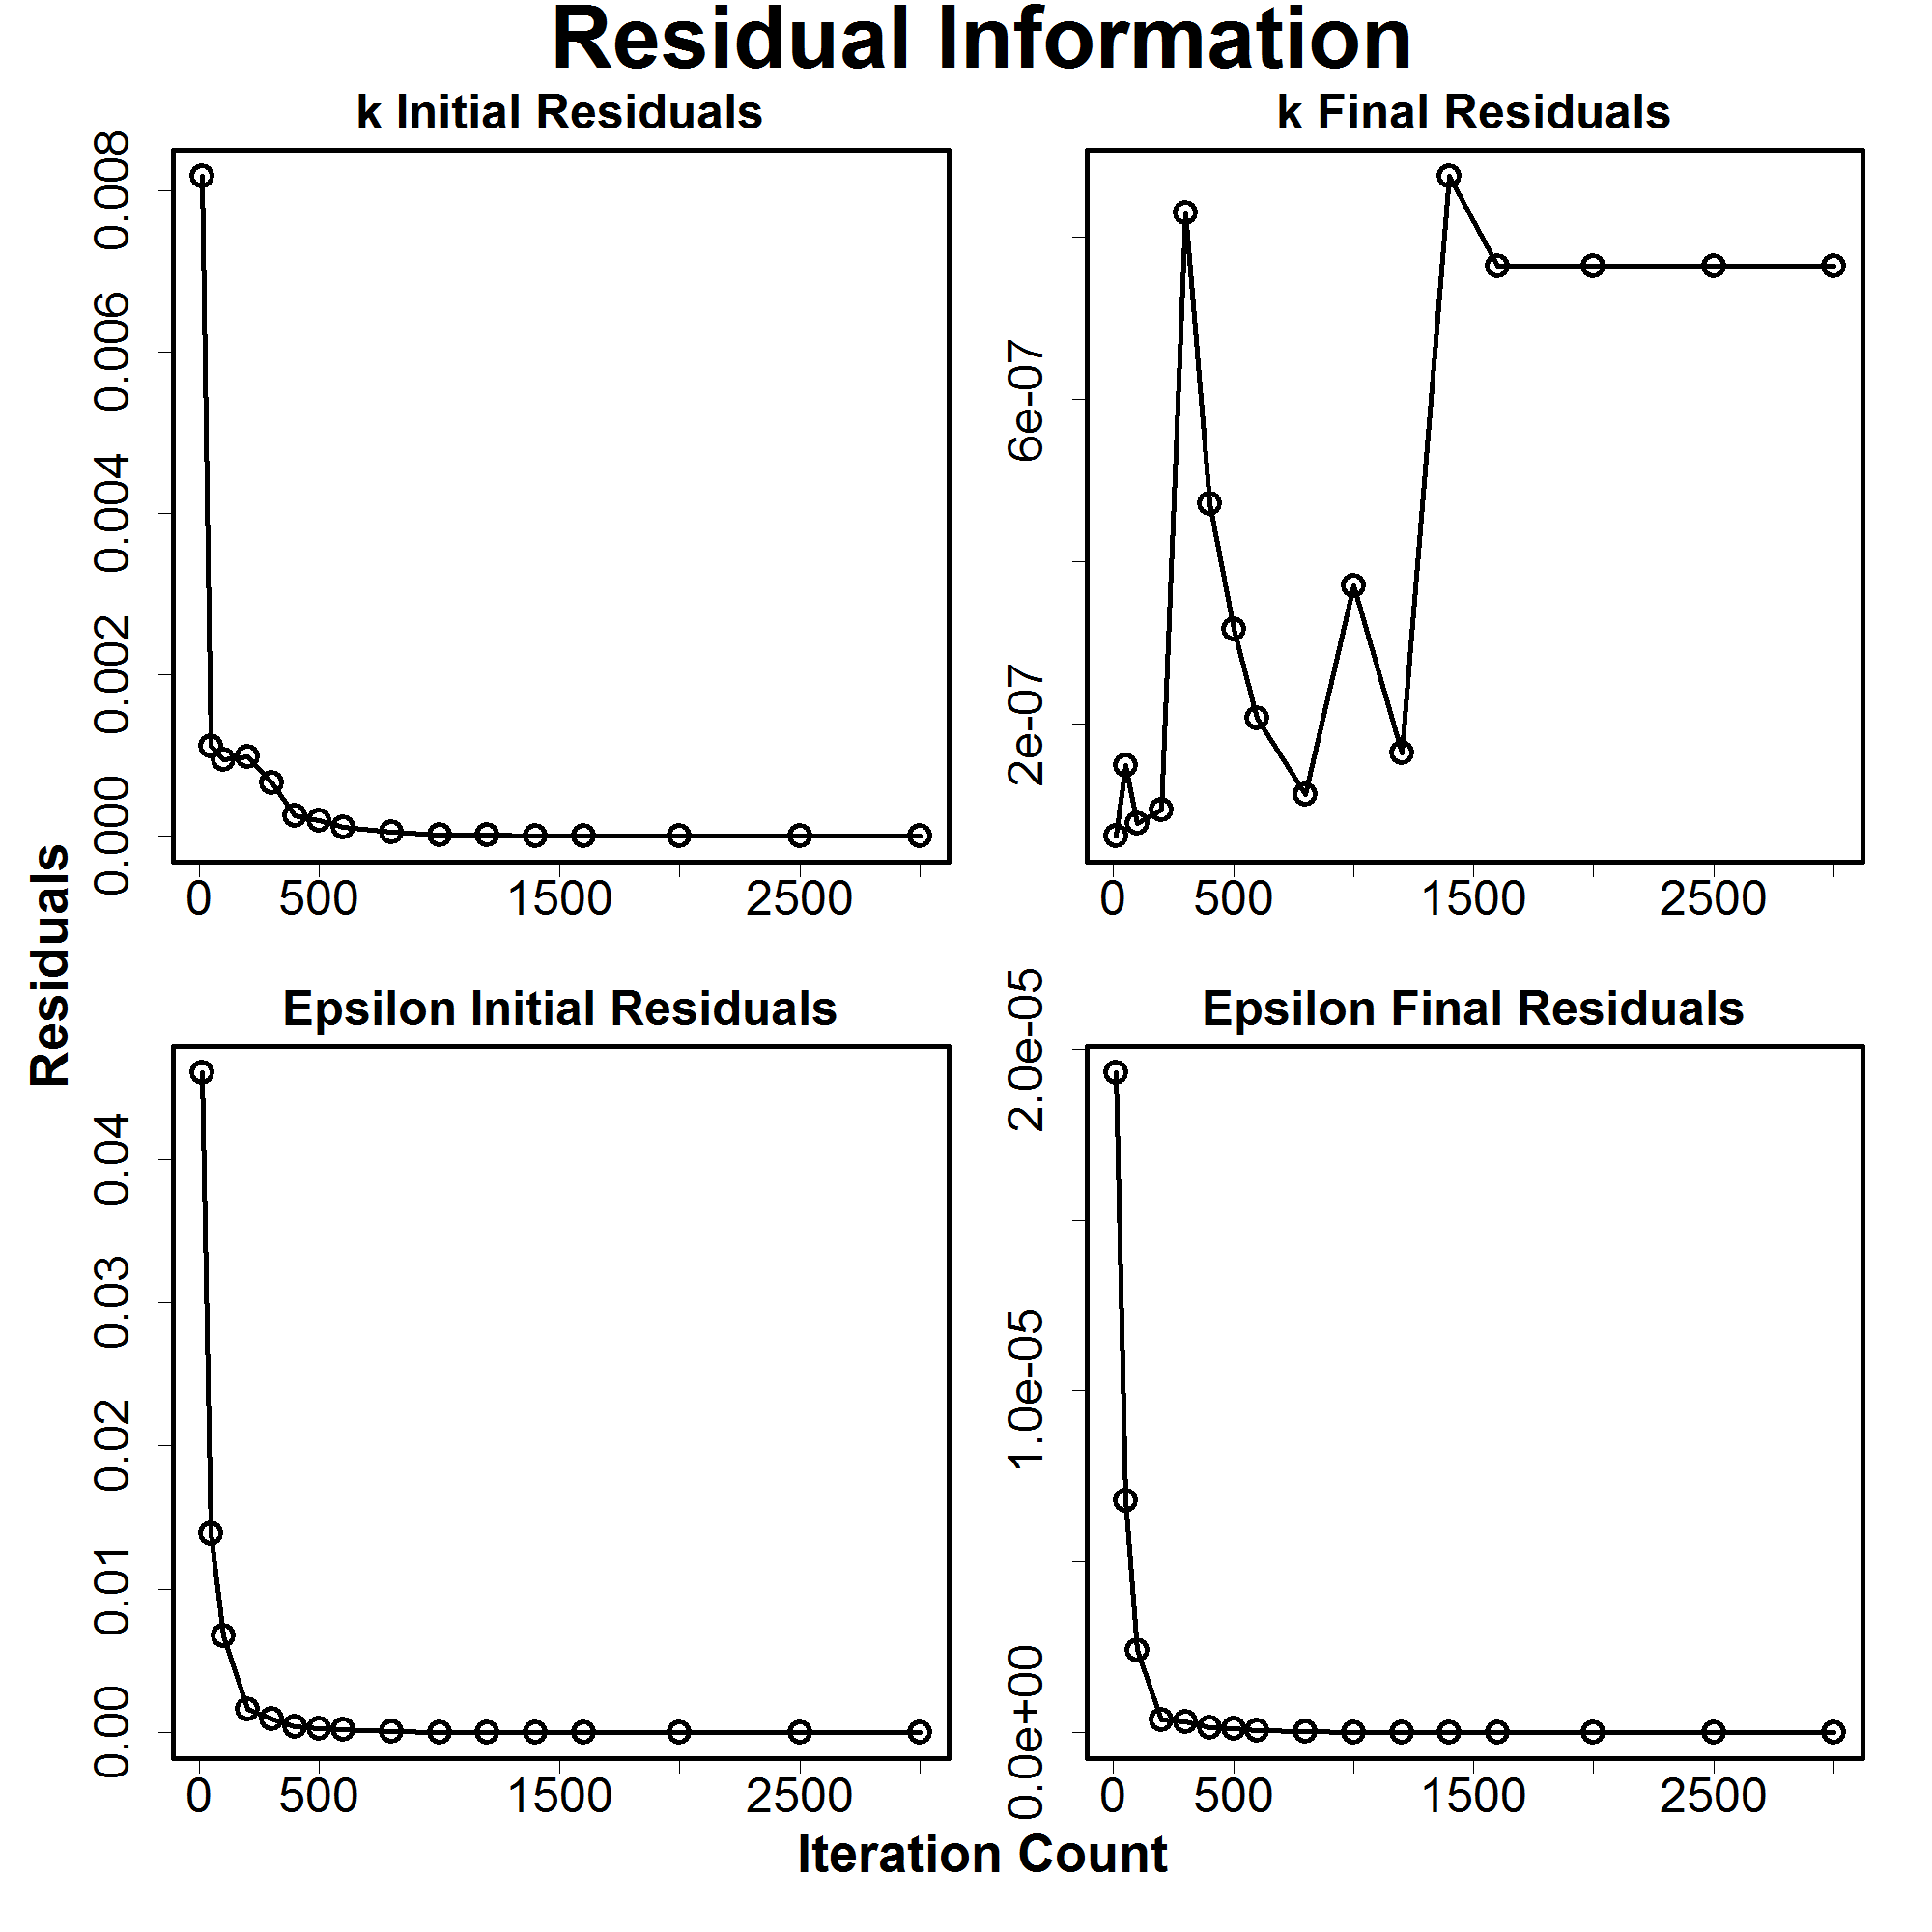
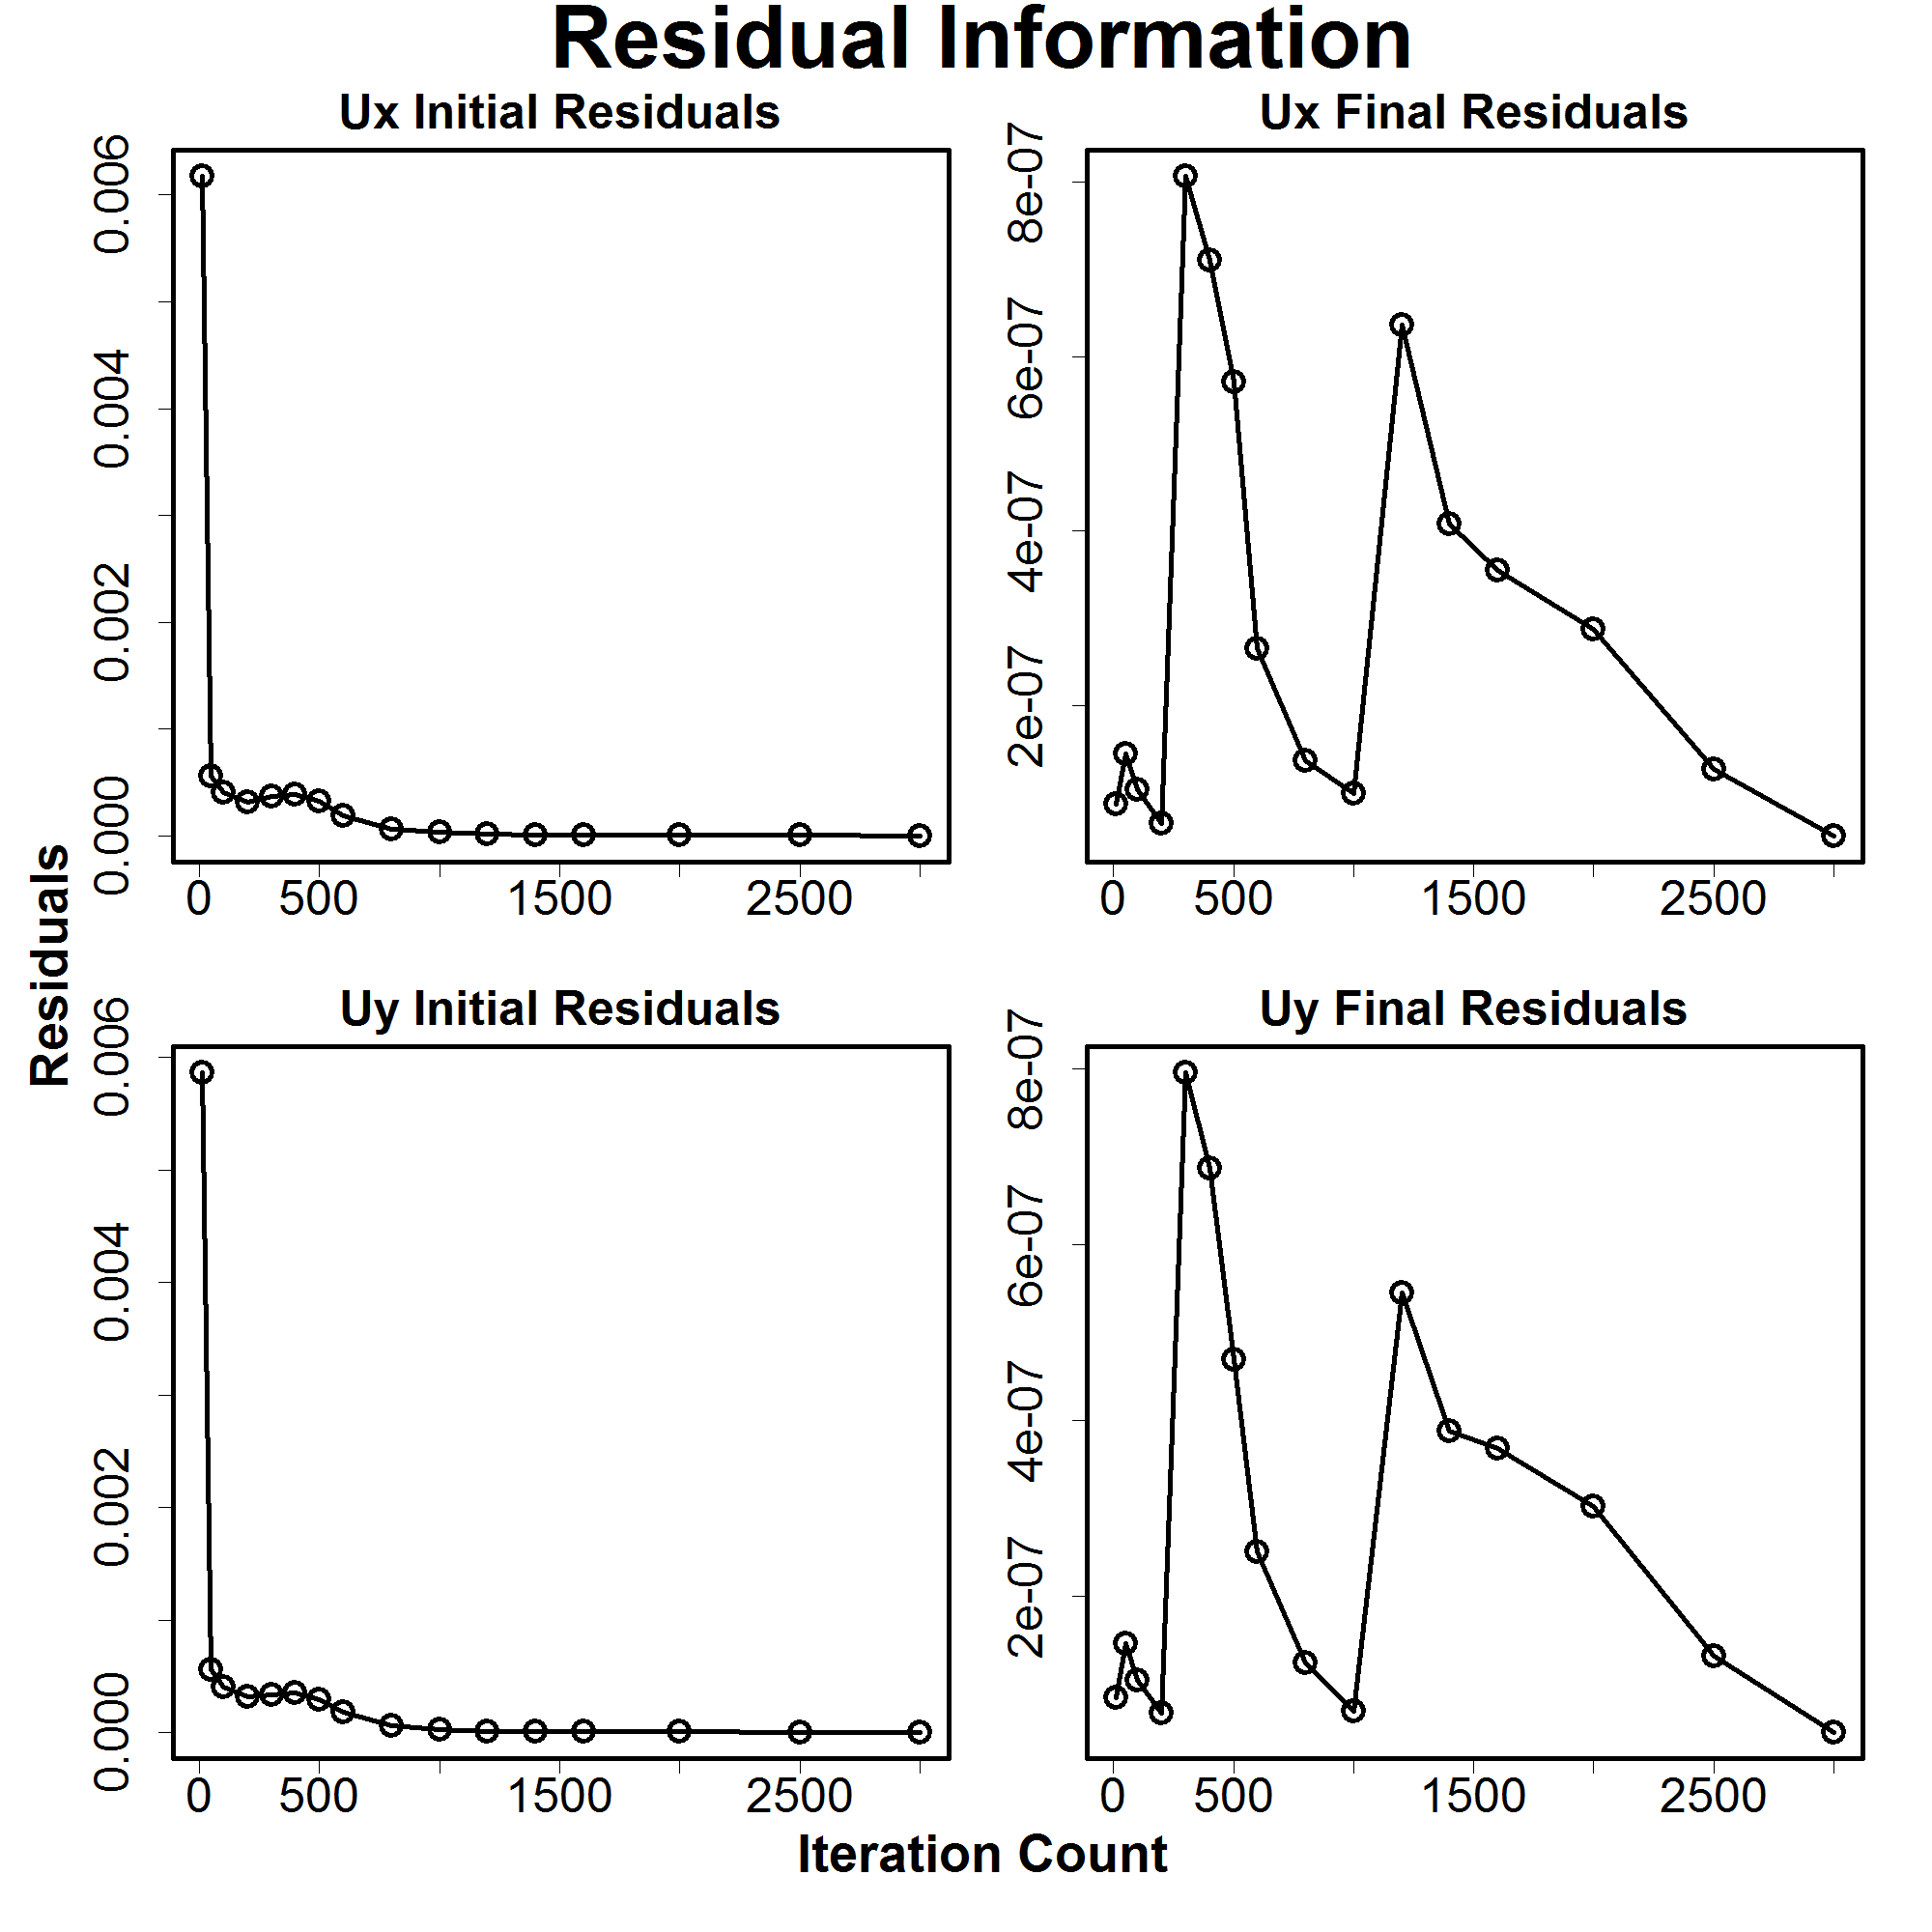
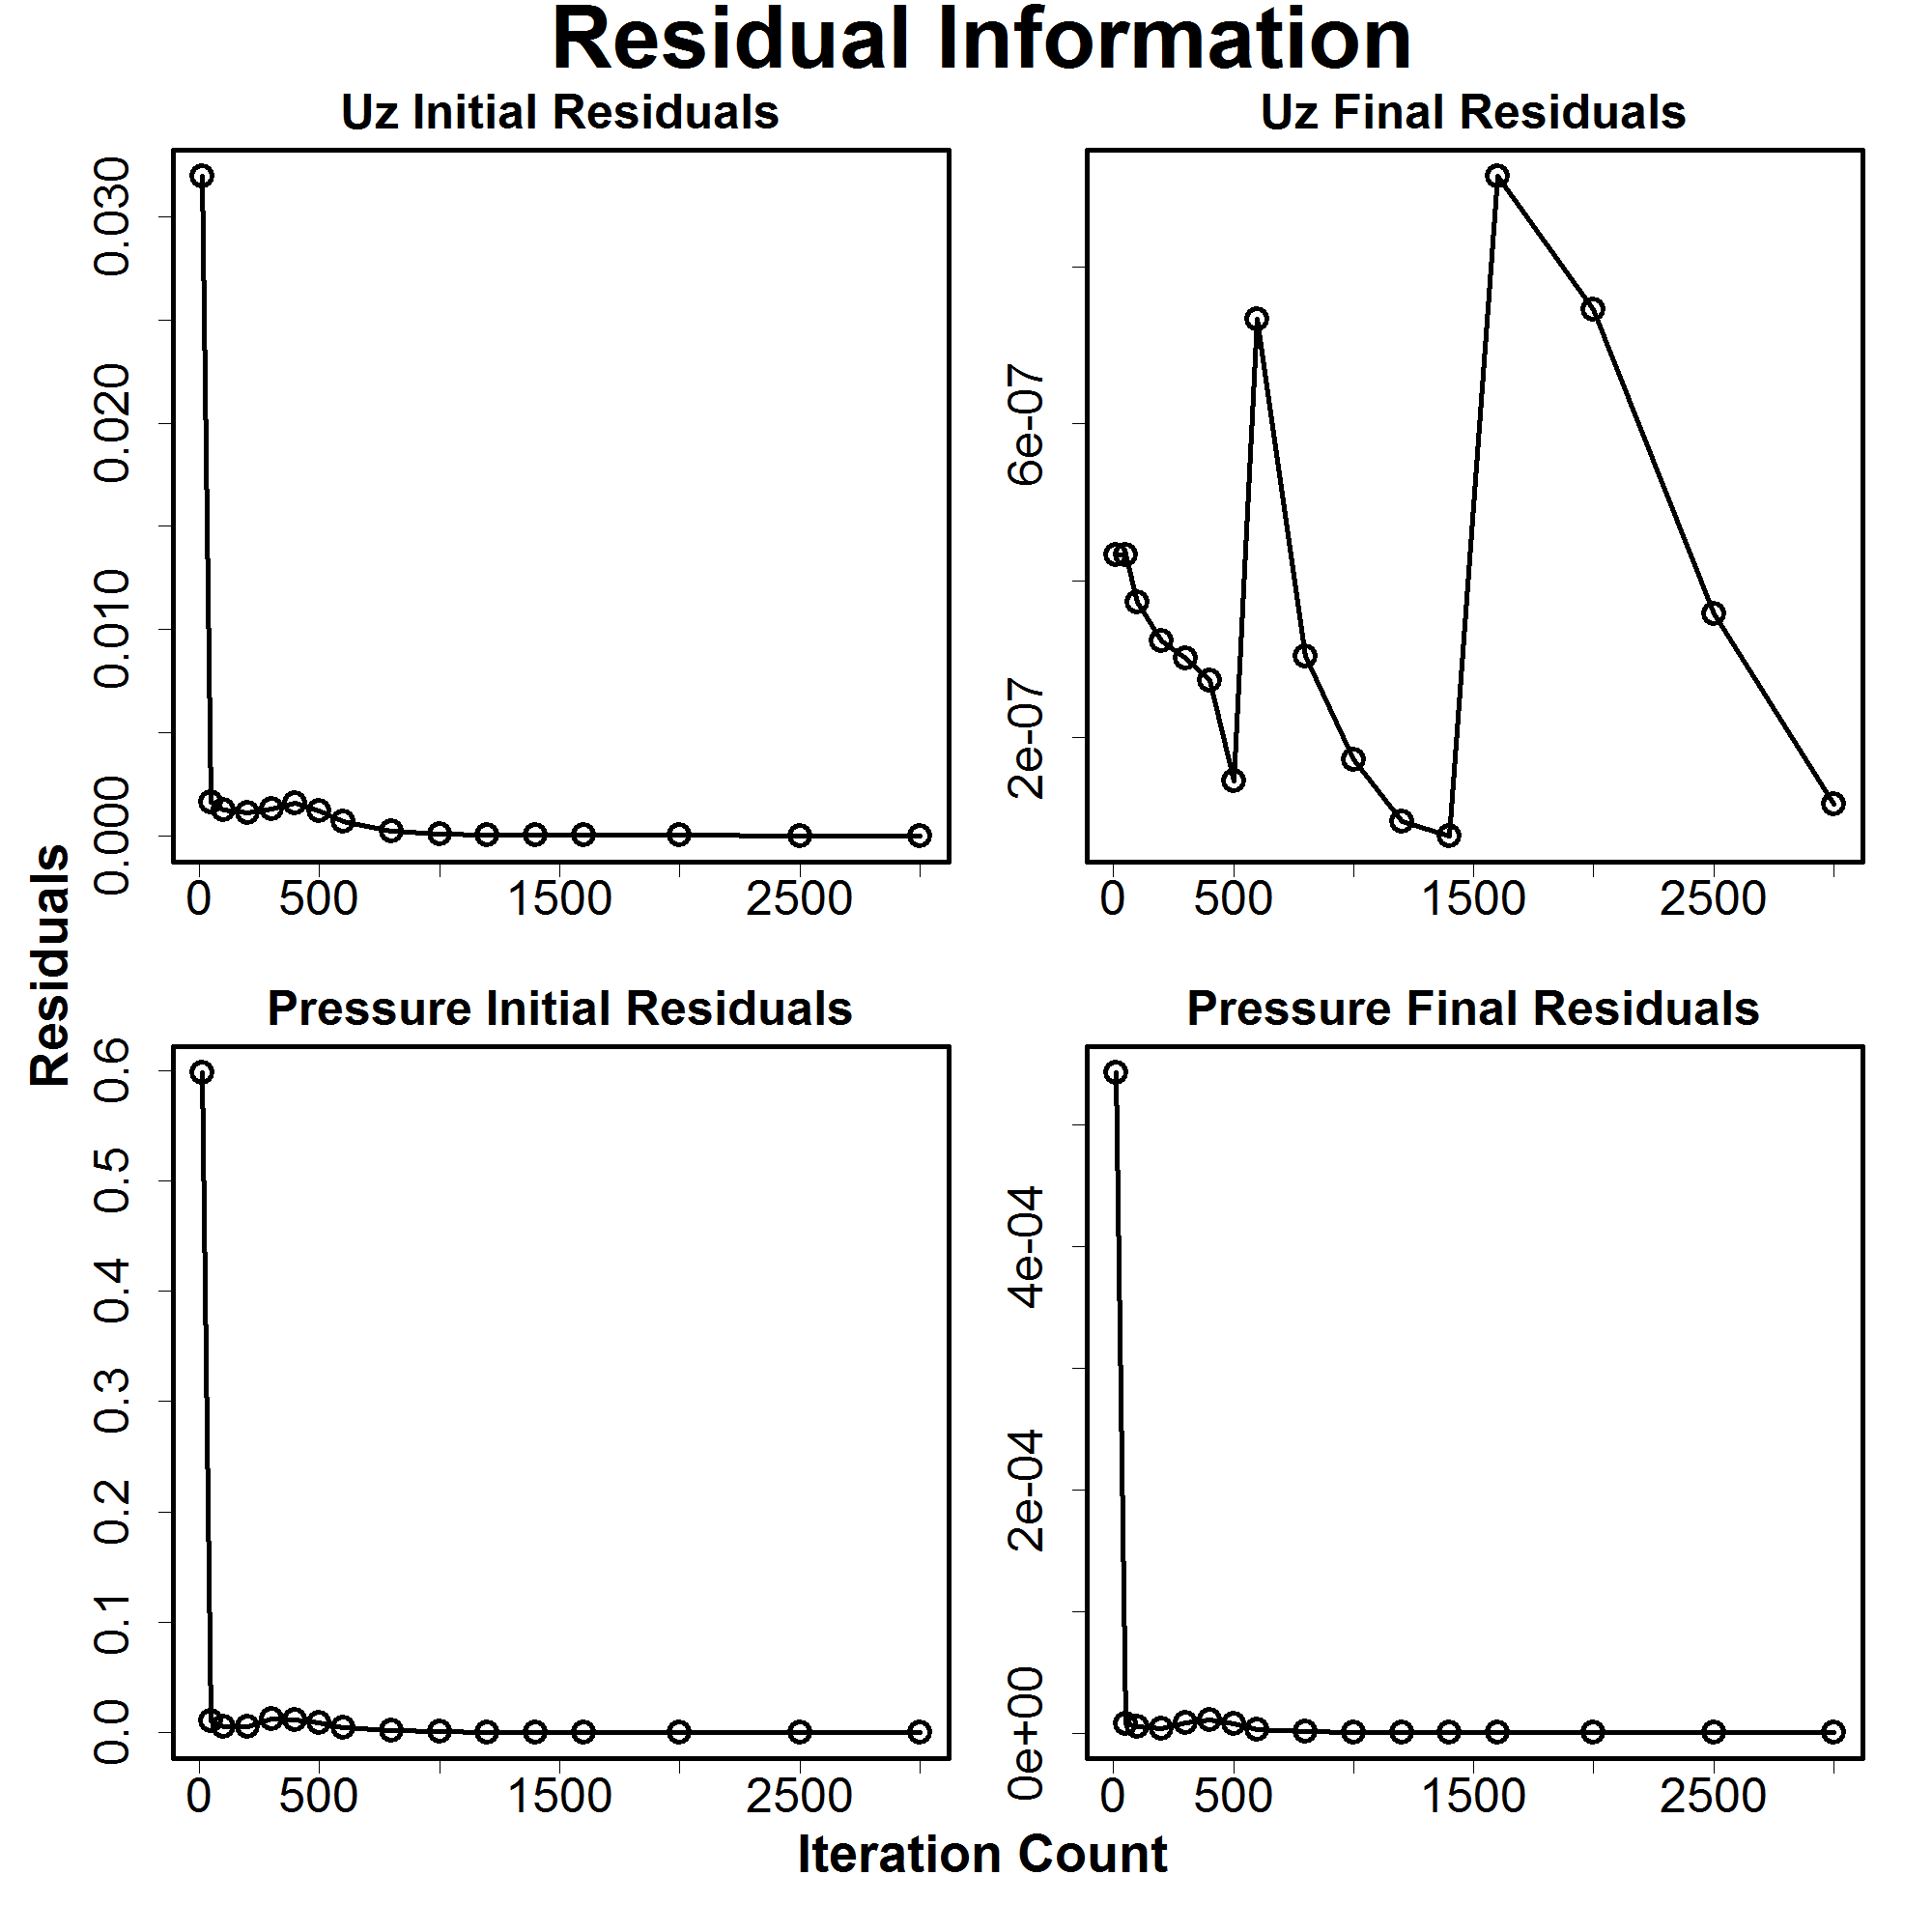
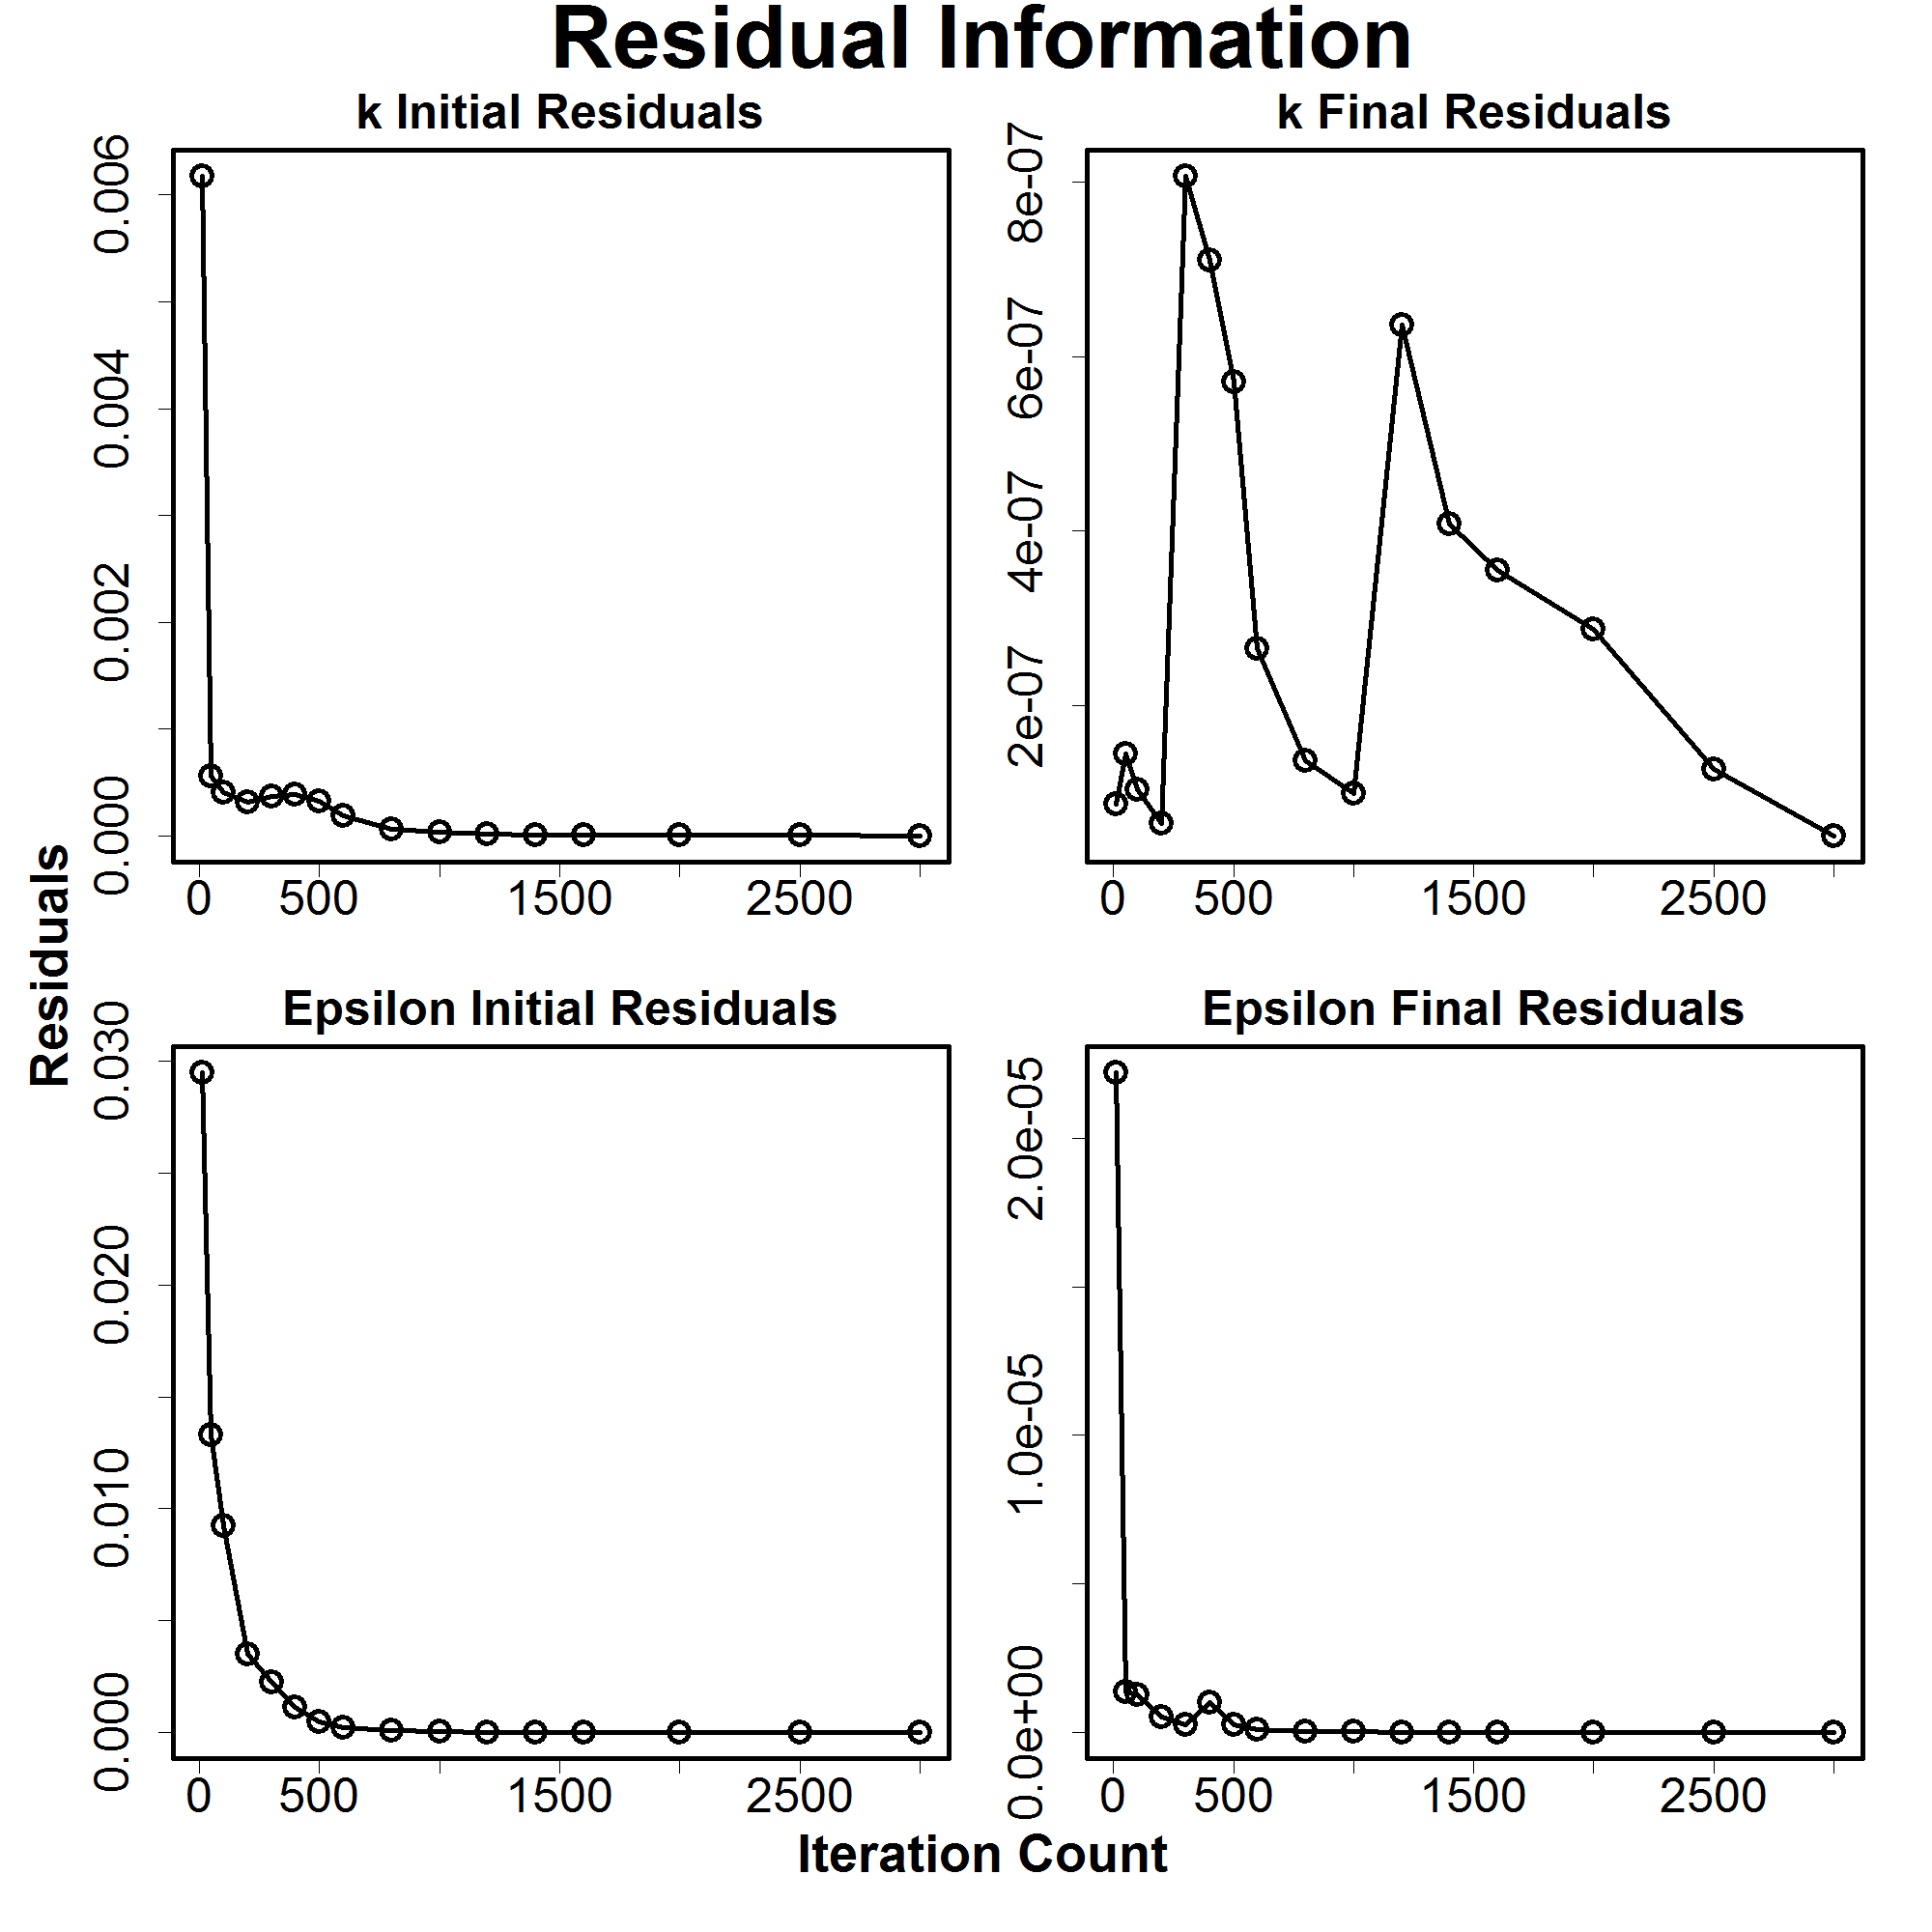
Residual Plots: These plots are really handy for making sure that WindNinja's solver is working correctly. During each solver step, the solver compares many solved variables at each step with the same solved variables from the previous step. These differences are the residuals and help the solver know when to properly change calculation steps.
These plots are the residuals at the start of the final iteration and at the end of the final iteration. The fact that the residuals change from relatively big values to very small values means that WindNinja is working properly.
The variable symbols mean the following:
Ux is the wind component in the east-west direction.
Uy is the wind component in the north-south direction.
Uz is the wind component normal to a flat surface.
Pressure is the pressure at the specific point.
k is the turbulent kinetic energy per unit mass as used in the k-ε formula for Reynold's Stresses
Epsilon is the rate of dissipation of turbulent kinetic energy as used in the k-ε formula for Reynold's Stresses
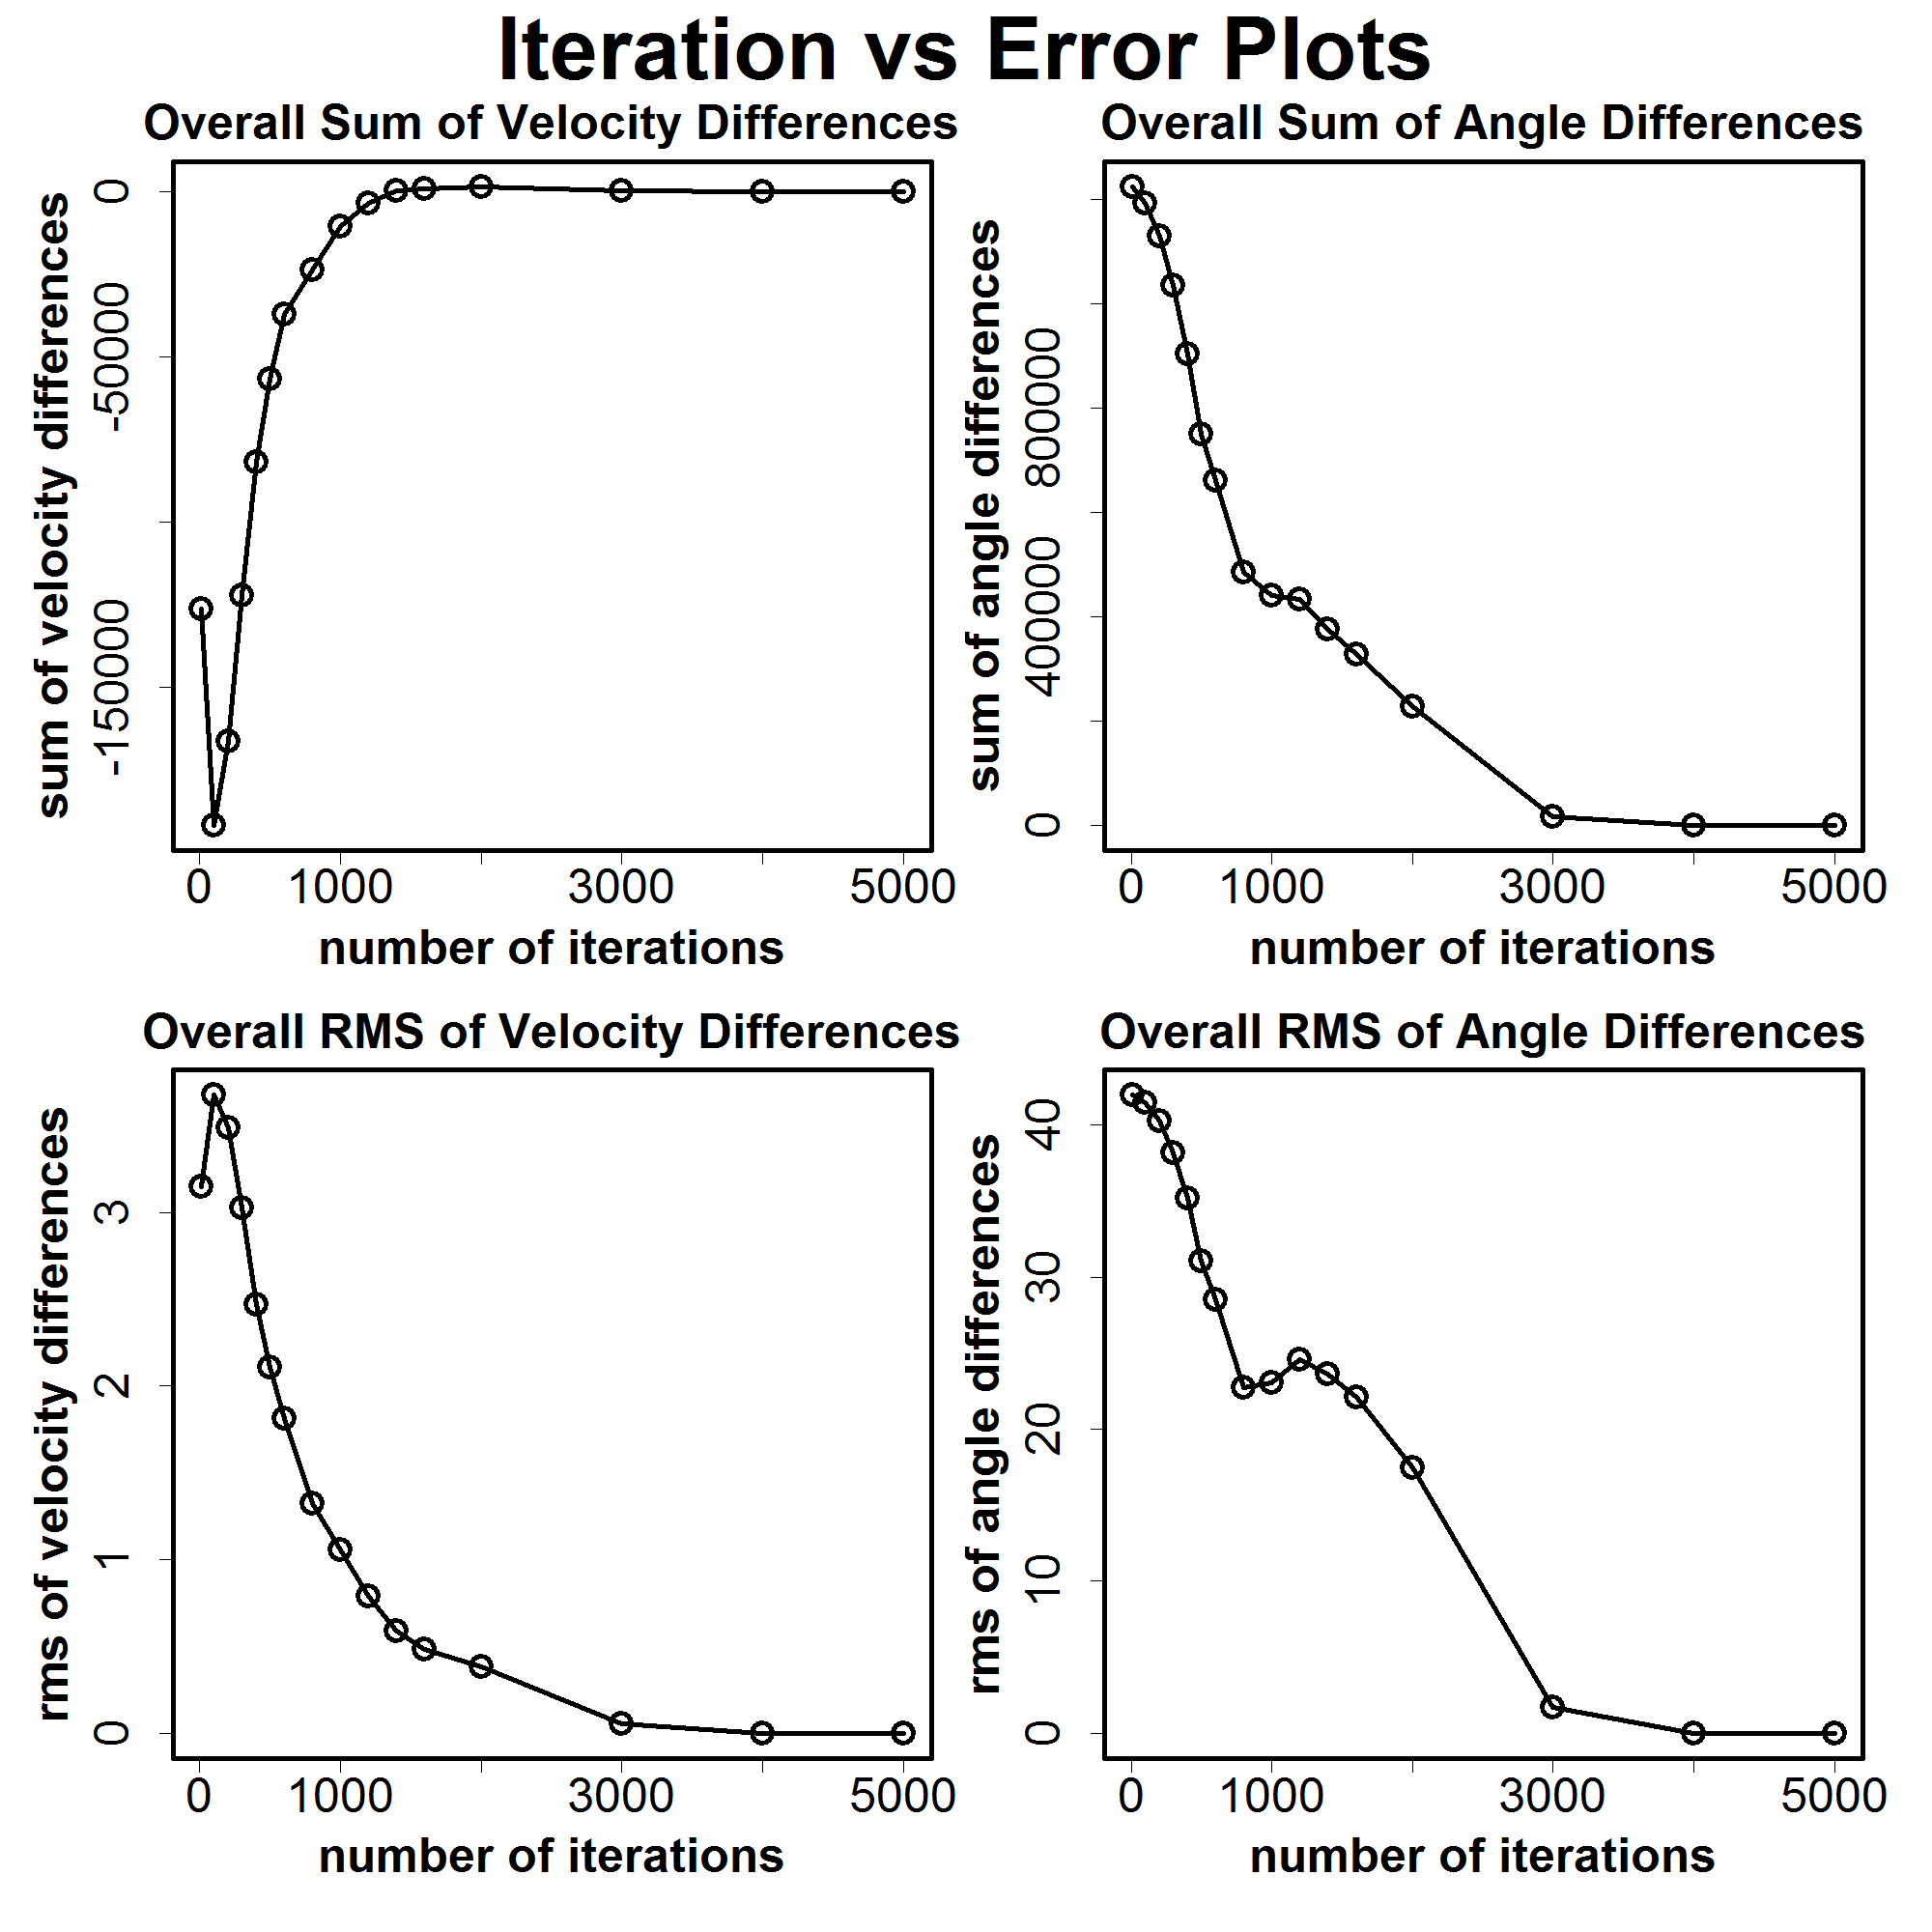
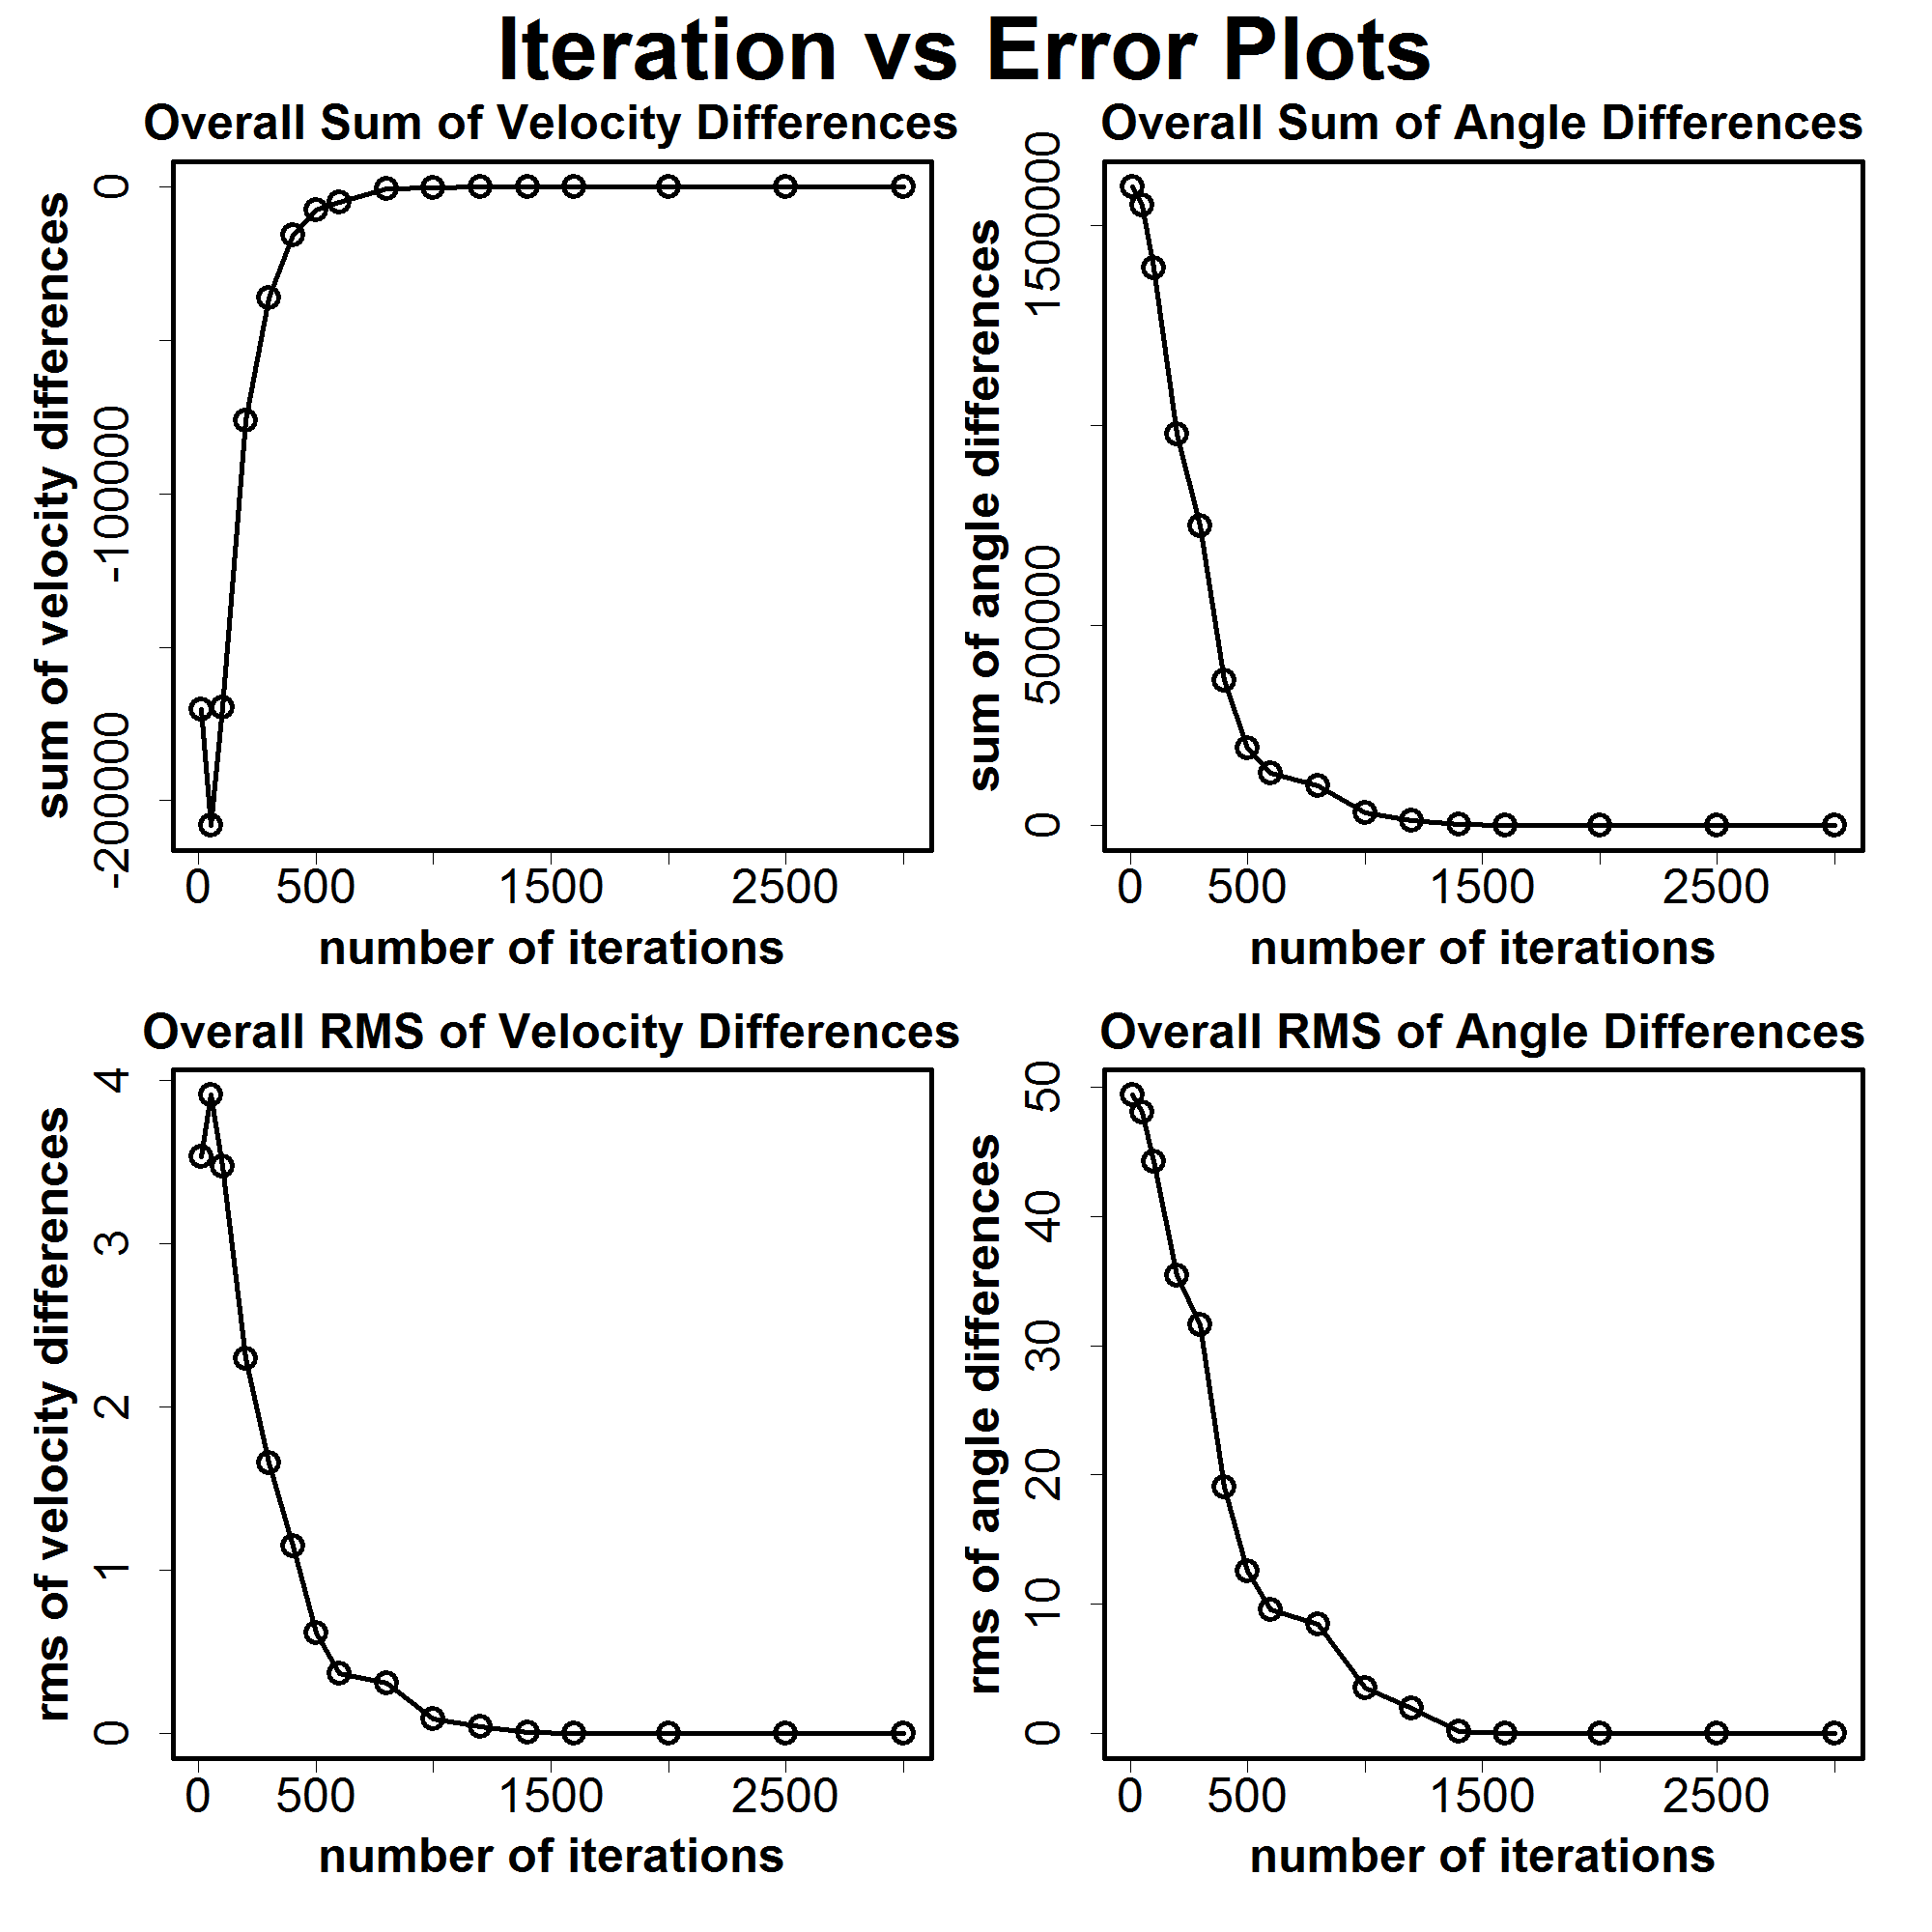
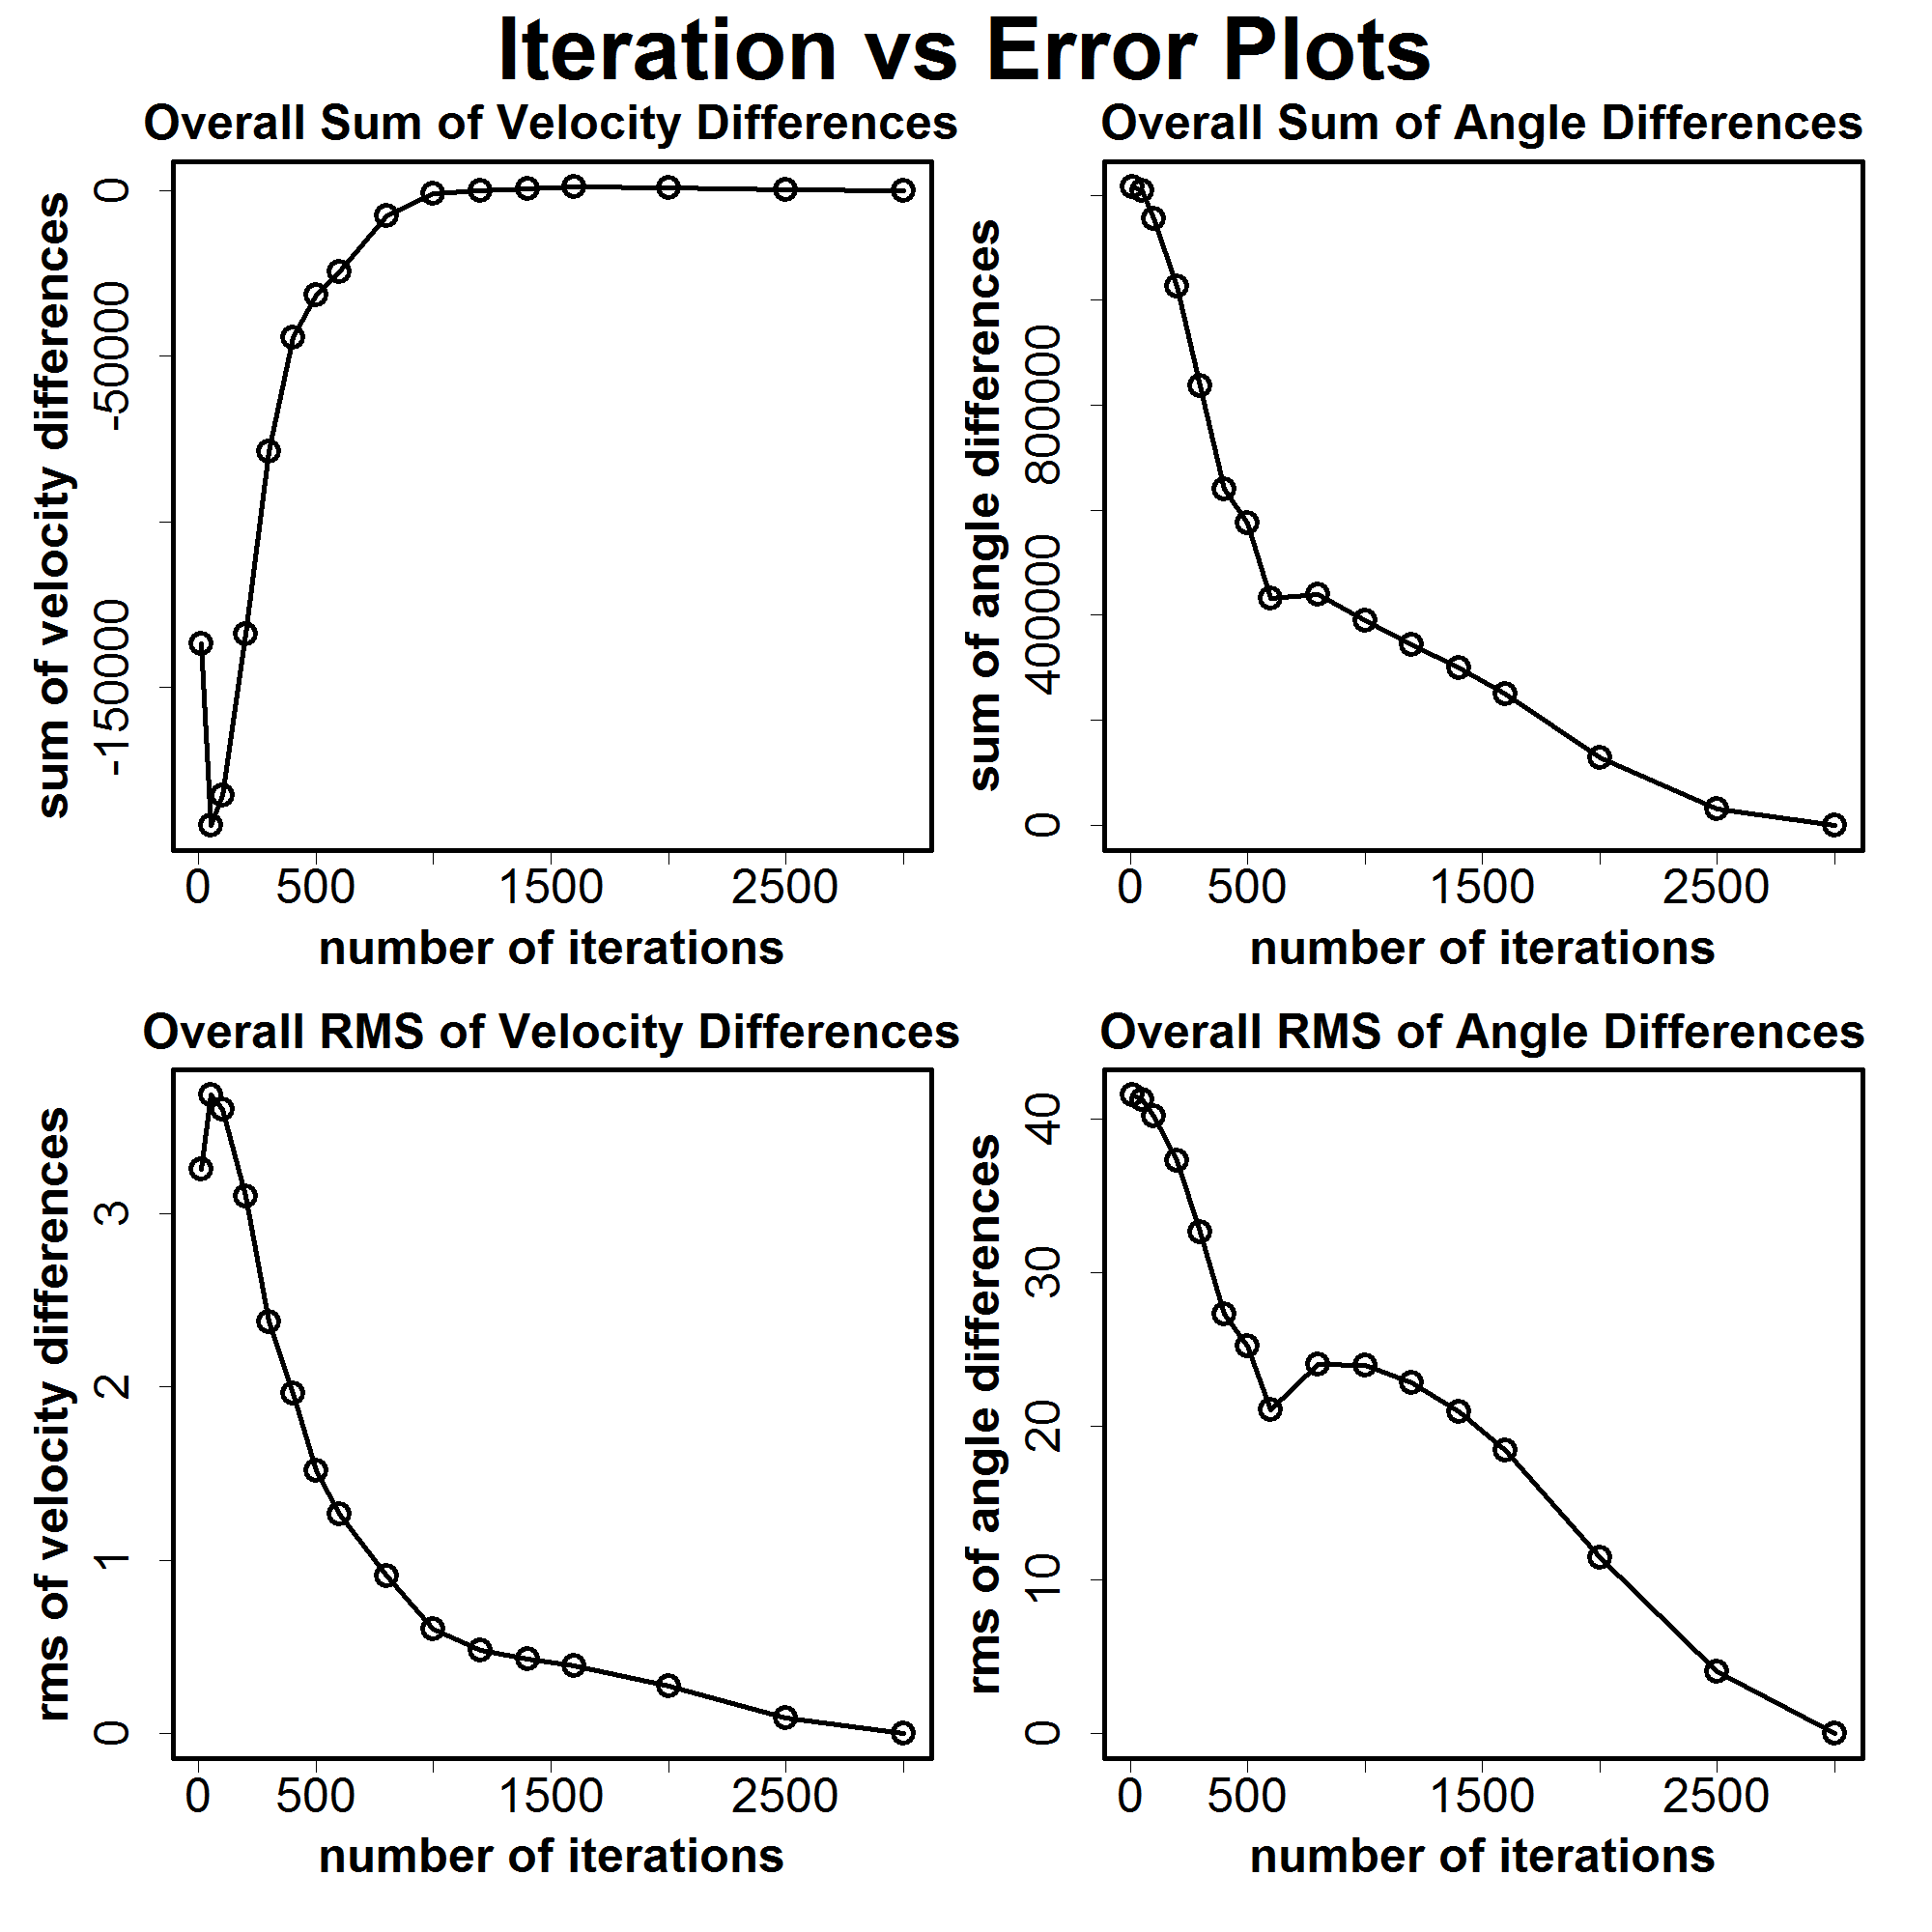
Iteration vs Error Plots: These plots are handy for seeing the progression to full convergence in a single plot. The sum plots are the sum of all the velocity differences and angle differences at each iteration. The RMS plots are the Root Mean Square of all the velocity and angle differences where the converged solution is used as the mean.
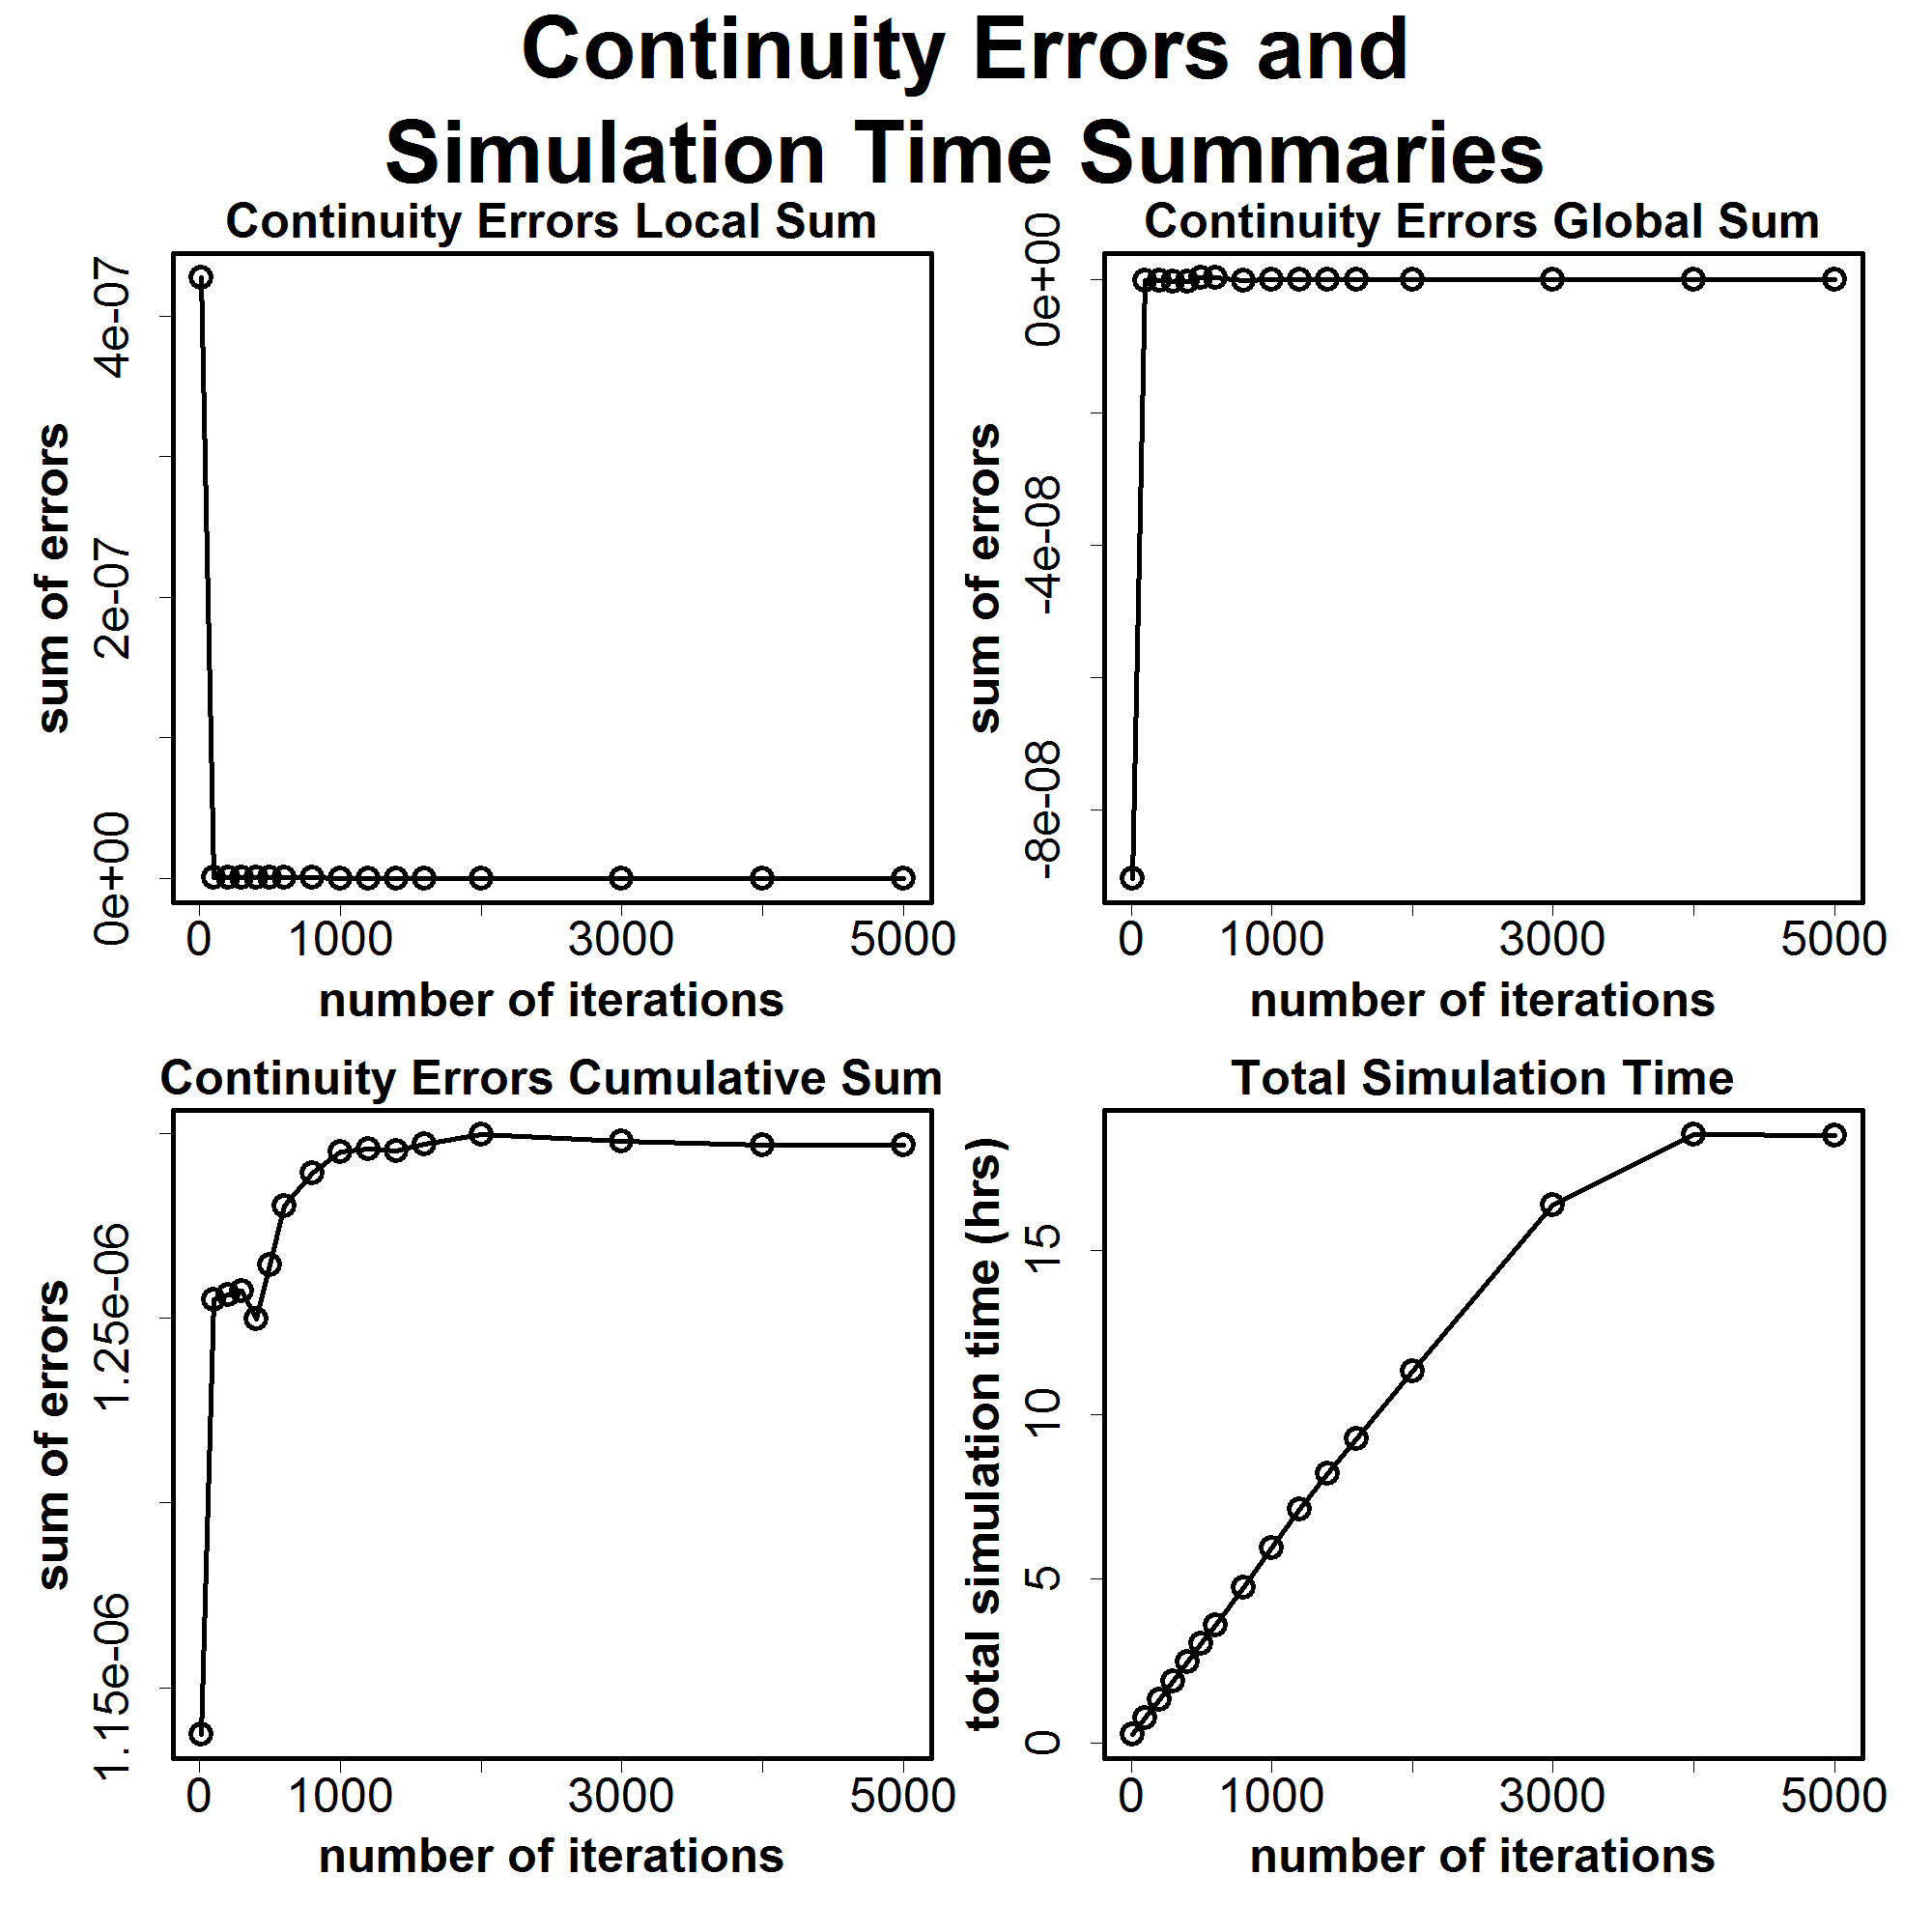
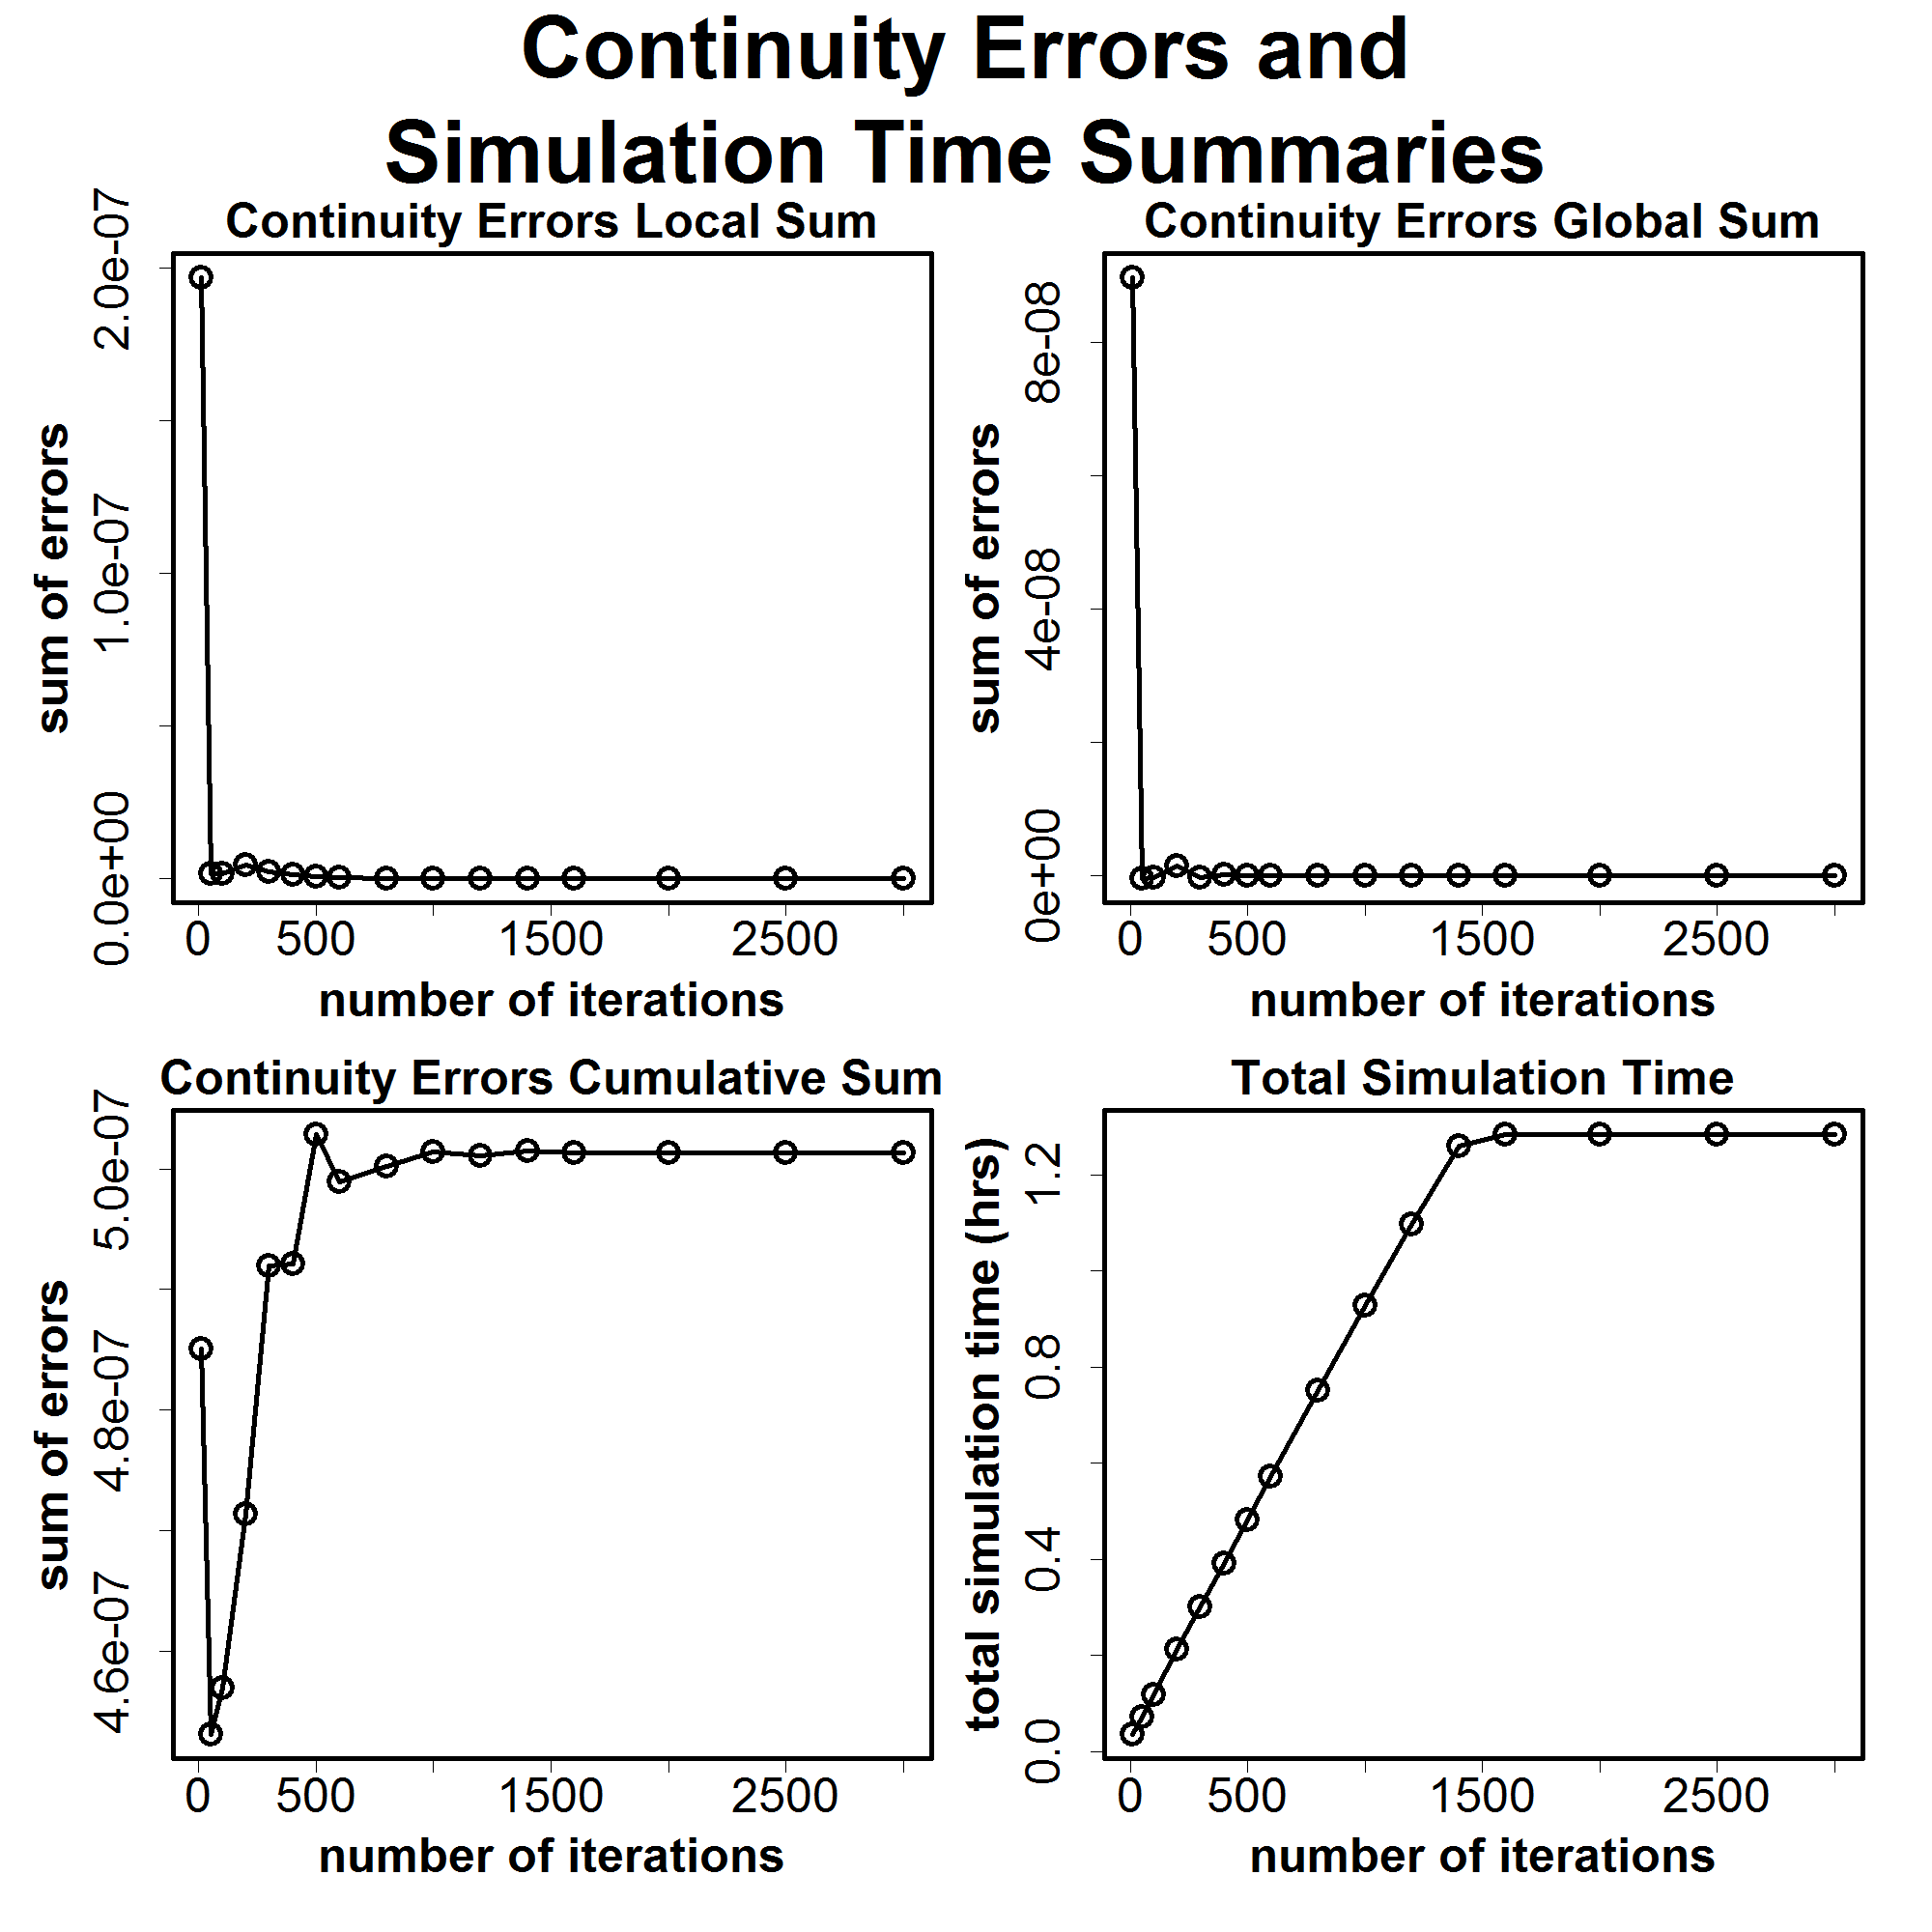
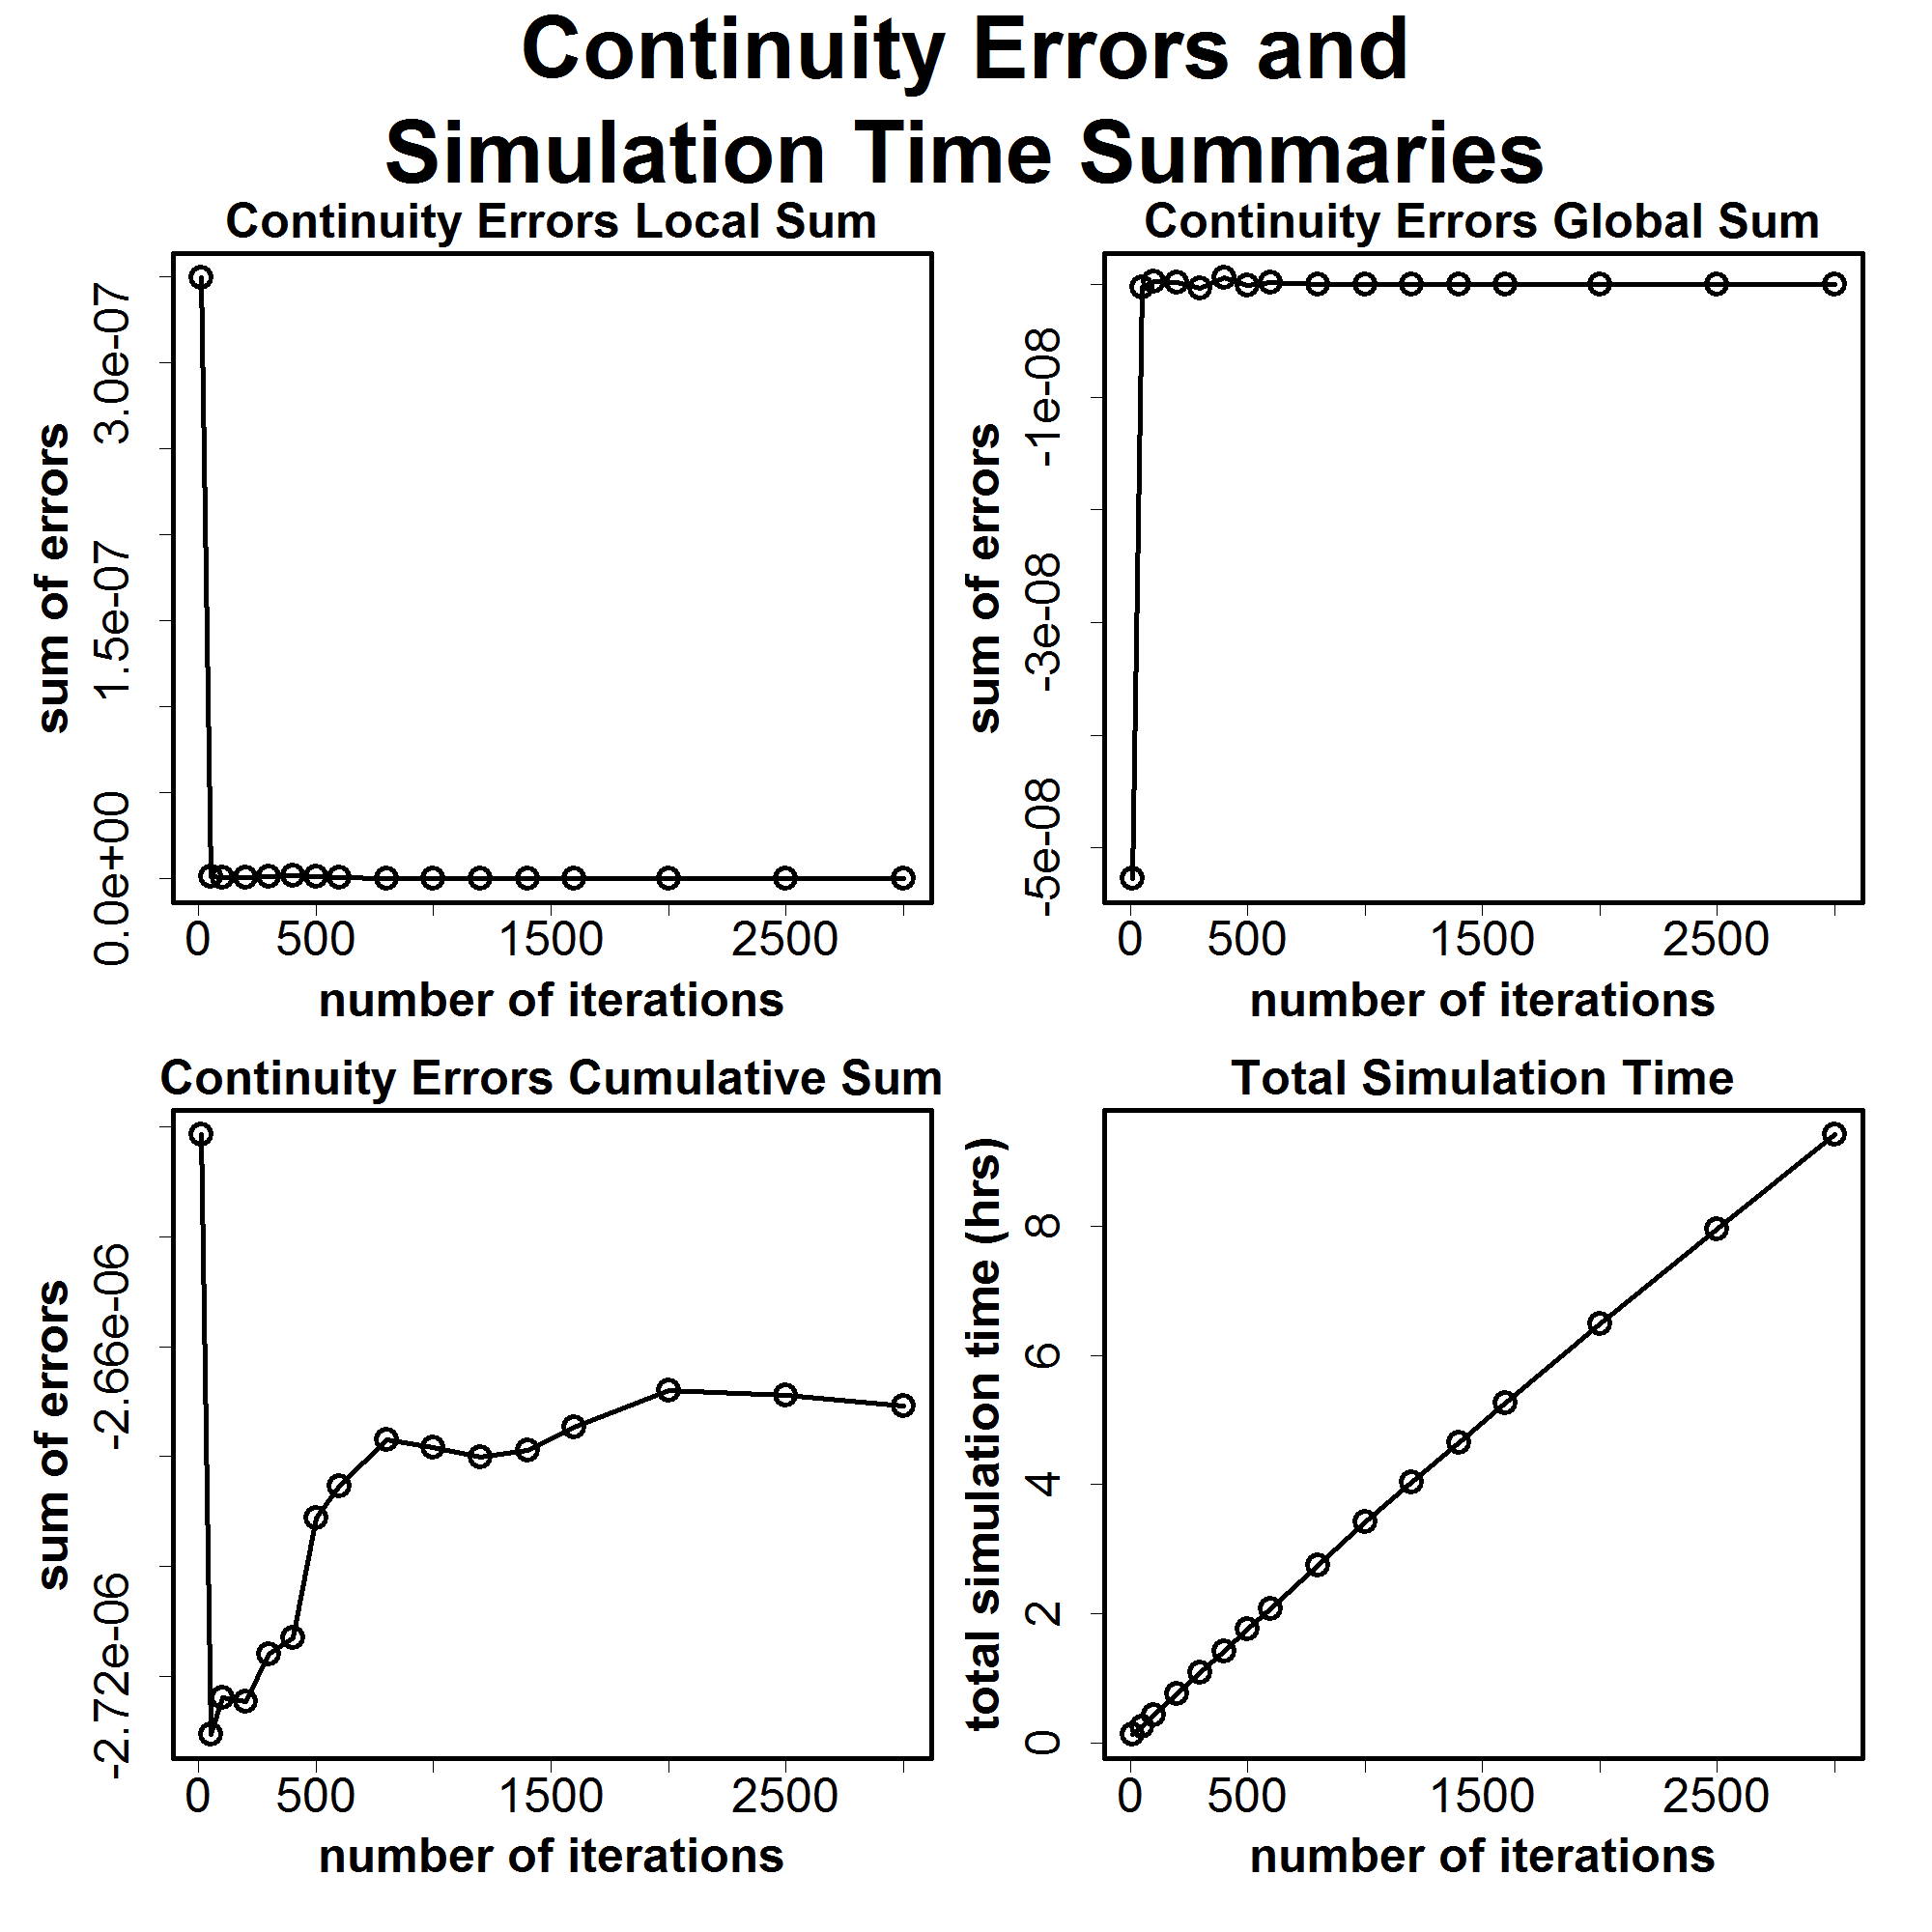
Continuity Errors and Simulation Time Summaries Plots: The continuity error plots are the values obtained from adding all the residuals at given iteration together. The residuals were obtained from the last calculation done by the solver at each given iteration. They help to know that WindNinja is working correctly.
The Total Simulation Time plot is more useful. It shows how long each simulation took when WindNinja's solver cuts off at different iterations. It shows the reason why running WindNinja at fewer iterations is so important.
Results
Big Butte Small: Coarse Resolution
Big Butte Small: Medium Resolution
Big Butte Small: Fine Resolution